
Page 203 - Artificial Intelligence for Computational Modeling of the Heart
P. 203
Chapter 5 Machine learning methods for robust parameter estimation 175
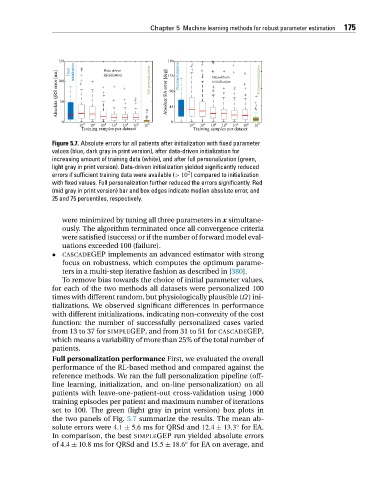
Figure 5.7. Absolute errors for all patients after initialization with fixed parameter
values (blue, dark gray in print version), after data-driven initialization for
increasing amount of training data (white), and after full personalization (green,
light gray in print version). Data-driven initialization yielded significantly reduced
2
errors if sufficient training data were available (> 10 ) compared to initialization
with fixed values. Full personalization further reduced the errors significantly. Red
(mid gray in print version) bar and box edges indicate median absolute error, and
25 and 75 percentiles, respectively.
were minimized by tuning all three parameters in x simultane-
ously. The algorithm terminated once all convergence criteria
were satisfied (success) or if the number of forward model eval-
uations exceeded 100 (failure).
• CASCADEGEP implements an advanced estimator with strong
focus on robustness, which computes the optimum parame-
ters in a multi-step iterative fashion as described in [380].
To remove bias towards the choice of initial parameter values,
for each of the two methods all datasets were personalized 100
times with different random, but physiologically plausible (Ω)ini-
tializations. We observed significant differences in performance
with different initializations, indicating non-convexity of the cost
function: the number of successfully personalized cases varied
from 13 to 37 for SIMPLEGEP, andfrom31to51for CASCADEGEP,
which means a variability of more than 25% of the total number of
patients.
Full personalization performance First, we evaluated the overall
performance of the RL-based method and compared against the
reference methods. We ran the full personalization pipeline (off-
line learning, initialization, and on-line personalization) on all
patients with leave-one-patient-out cross-validation using 1000
training episodes per patient and maximum number of iterations
set to 100. The green (light gray in print version) box plots in
the two panels of Fig. 5.7 summarize the results. The mean ab-
◦
solute errors were 4.1 ± 5.6 ms for QRSd and 12.4 ± 13.3 for EA.
In comparison, the best SIMPLEGEP run yielded absolute errors
of 4.4 ± 10.8 ms for QRSd and 15.5 ± 18.6 for EA on average, and
◦