
Page 206 - Artificial Intelligence for Computational Modeling of the Heart
P. 206
178 Chapter 5 Machine learning methods for robust parameter estimation
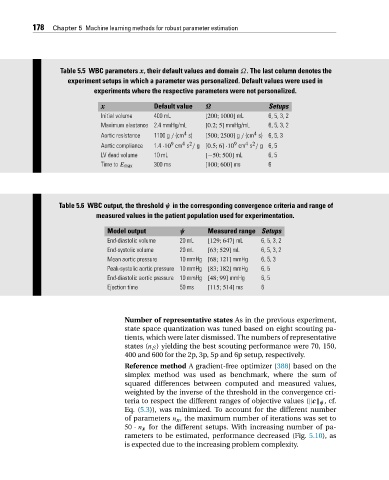
Table 5.5 WBC parameters x, their default values and domain Ω. The last column denotes the
experiment setups in which a parameter was personalized. Default values were used in
experiments where the respective parameters were not personalized.
x Default value Ω Setups
Initial volume 400 mL [200;1000] mL 6, 5, 3, 2
Maximum elastance 2.4 mmHg/mL [0.2;5] mmHg/mL 6, 5, 3, 2
4
4
Aortic resistance 1100 g / (cm s) [500;2500] g / (cm s) 6, 5, 3
4 2
9
9
4 2
Aortic compliance 1.4 ·10 cm s / g [0.5;6]·10 cm s / g6, 5
LV dead volume 10 mL [−50;500] mL 6, 5
Time to E max 300 ms [100;600] ms 6
Table 5.6 WBC output, the threshold ψ in the corresponding convergence criteria and range of
measured values in the patient population used for experimentation.
Model output ψ Measured range Setups
End-diastolic volume 20 mL [129;647] mL 6, 5, 3, 2
End-systolic volume 20 mL [63;529] mL 6, 5, 3, 2
Mean aortic pressure 10 mmHg [68;121] mmHg 6, 5, 3
Peak-systolic aortic pressure 10 mmHg [83;182] mmHg 6, 5
End-diastolic aortic pressure 10 mmHg [48;99] mmHg 6, 5
Ejection time 50 ms [115;514] ms 6
Number of representative states As in the previous experiment,
state space quantization was tuned based on eight scouting pa-
tients, which were later dismissed. The numbers of representative
states (n S ) yielding the best scouting performance were 70, 150,
400 and 600 for the 2p, 3p, 5p and 6p setup, respectively.
Reference method A gradient-free optimizer [388]based onthe
simplex method was used as benchmark, where the sum of
squared differences between computed and measured values,
weighted by the inverse of the threshold in the convergence cri-
teria to respect the different ranges of objective values ( c ψ ,cf.
Eq. (5.3)), was minimized. To account for the different number
of parameters n x , the maximum number of iterations was set to
50 · n x for the different setups. With increasing number of pa-
rameters to be estimated, performance decreased (Fig. 5.10), as
is expected due to the increasing problem complexity.