
Page 239 - Artificial Intelligence in the Age of Neural Networks and Brain Computing
P. 239
230 CHAPTER 11 Deep Learning Approaches to Electrophysiological
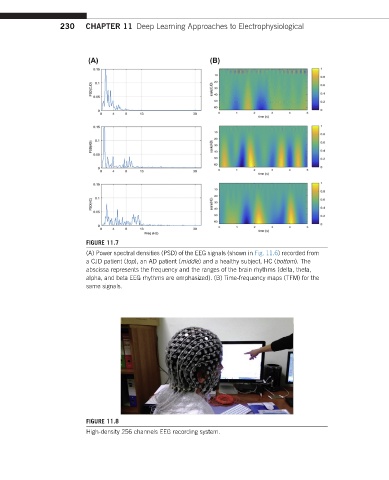
FIGURE 11.7
(A) Power spectral densities (PSD) of the EEG signals (shown in Fig. 11.6) recorded from
a CJD patient (top), an AD patient (middle) and a healthy subject, HC (bottom). The
abscissa represents the frequency and the ranges of the brain rhythms (delta, theta,
alpha, and beta EEG rhythms are emphasized). (B) Time-frequency maps (TFM) for the
same signals.
FIGURE 11.8
High-density 256 channels EEG recording system.