
Page 201 - Assurance of Sterility for Sensitive Combination Products and Materials
P. 201
Risk to the patient—Quantifying assurance of sterility 181
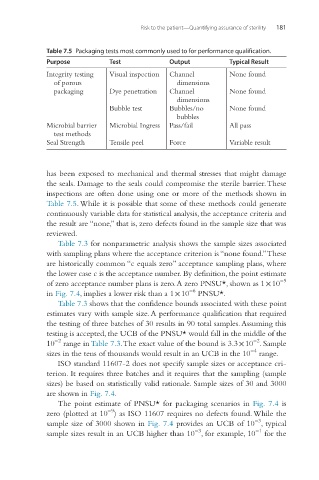
Table 7.5 Packaging tests most commonly used to for performance qualification.
Purpose Test Output Typical Result
Integrity testing Visual inspection Channel None found
of porous dimensions
packaging Dye penetration Channel None found
dimensions
Bubble test Bubbles/no None found
bubbles
Microbial barrier Microbial Ingress Pass/fail All pass
test methods
Seal Strength Tensile peel Force Variable result
has been exposed to mechanical and thermal stresses that might damage
the seals. Damage to the seals could compromise the sterile barrier. These
inspections are often done using one or more of the methods shown in
Table 7.5. While it is possible that some of these methods could generate
continuously variable data for statistical analysis, the acceptance criteria and
the result are “none,” that is, zero defects found in the sample size that was
reviewed.
Table 7.3 for nonparametric analysis shows the sample sizes associated
with sampling plans where the acceptance criterion is “none found.” These
are historically common “c equals zero” acceptance sampling plans, where
the lower case c is the acceptance number. By definition, the point estimate
−9
of zero acceptance number plans is zero. A zero PNSU*, shown as 1 × 10
−6
in Fig. 7.4, implies a lower risk than a 1 × 10 PNSU*.
Table 7.3 shows that the confidence bounds associated with these point
estimates vary with sample size. A performance qualification that required
the testing of three batches of 30 results in 90 total samples. Assuming this
testing is accepted, the UCB of the PNSU* would fall in the middle of the
−2
−2
10 range in Table 7.3. The exact value of the bound is 3.3 × 10 . Sample
−4
sizes in the tens of thousands would result in an UCB in the 10 range.
ISO standard 11607-2 does not specify sample sizes or acceptance cri-
terion. It requires three batches and it requires that the sampling (sample
sizes) be based on statistically valid rationale. Sample sizes of 30 and 3000
are shown in Fig. 7.4.
The point estimate of PNSU* for packaging scenarios in Fig. 7.4 is
−9
zero (plotted at 10 ) as ISO 11607 requires no defects found. While the
−3
sample size of 3000 shown in Fig. 7.4 provides an UCB of 10 , typical
−1
−3
sample sizes result in an UCB higher than 10 , for example, 10 for the