
Page 312 - Automotive Engineering Powertrain Chassis System and Vehicle Body
P. 312
Tyres and wheels C HAPTER 10.1
1.2
1.0
Lateral coefficient of friction µ Y,W 0.6
0.8
0.4
0.2
Slip angle
Dry, rough concrete Dry, smooth concrete Snow cover Rough ice cover
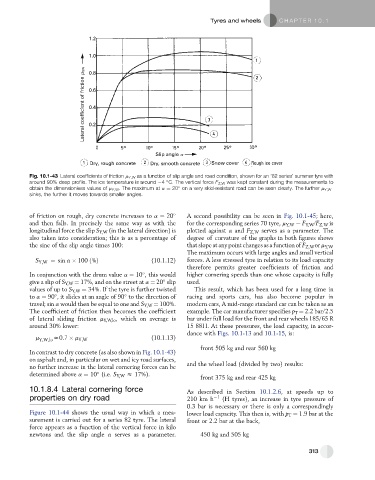
Fig. 10.1-43 Lateral coefficients of friction m Y,W as a function of slip angle and road condition, shown for an ‘82 series’ summer tyre with
around 90% deep profile. The ice temperature is around 4 C. The vertical force F Z,W was kept constant during the measurements to
obtain the dimensionless values of m Y,W . The maximum at a ¼ 20 on a very skid-resistant road can be seen clearly. The further m Y,W
sinks, the further it moves towards smaller angles.
of friction on rough, dry concrete increases to a ¼ 20 A second possibility can be seen in Fig. 10.1-45; here,
and then falls. In precisely the same way as with the for the corresponding series 70 tyre, m Y,W ¼ F Y,W /F Z,W is
longitudinal force the slip S Y,W (in the lateral direction) is plotted against a and F Z,W serves as a parameter. The
also taken into consideration; this is as a percentage of degree of curvature of the graphs in both figures shows
the sine of the slip angle times 100: that slope at any point changes as a function of F Z,W or m Y,W .
The maximum occurs with large angles and small vertical
S Y;W ¼ sin a 100 ð%Þ (10.1.12) forces. A less stressed tyre in relation to its load capacity
therefore permits greater coefficients of friction and
In conjunction with the drum value a ¼ 10 , this would higher cornering speeds than one whose capacity is fully
give a slip of S Y,W ¼ 17%, and on the street at a ¼ 20 slip used.
values of up to S Y,W ¼ 34%. If the tyre is further twisted This result, which has been used for a long time in
to a ¼ 90 , it slides at an angle of 90 to the direction of racing and sports cars, has also become popular in
travel; sin a would then be equal to one and S Y,W ¼ 100%. modern cars, A mid-range standard car can be taken as an
The coefficient of friction then becomes the coefficient example. The car manufacturer specifies p T ¼ 2.2 bar/2.5
of lateral sliding friction m Y,W,lo , which on average is bar under full load for the front and rear wheels 185/65 R
around 30% lower: 15 88H. At these pressures, the load capacity, in accor-
dance with Figs. 10.1-13 and 10.1-15, is:
m Y;W;lo z0:7 m Y;W (10.1.13)
front 505 kg and rear 560 kg
In contrast to dry concrete (as also shown in Fig. 10.1-43)
on asphalt and, in particular on wet and icy road surfaces,
no further increase in the lateral cornering forces can be and the wheel load (divided by two) results:
determined above a ¼ 10 (i.e. S Y,W z 17%).
front 375 kg and rear 425 kg
10.1.8.4 Lateral cornering force As described in Section 10.1.2.6, at speeds up to
properties on dry road 210 km h 1 (H tyres), an increase in tyre pressure of
0.3 bar is necessary or there is only a correspondingly
Figure 10.1-44 shows the usual way in which a mea- lower load capacity. This then is, with p T ¼ 1.9 bar at the
surement is carried out for a series 82 tyre. The lateral front or 2.2 bar at the back,
force appears as a function of the vertical force in kilo
newtons and the slip angle a serves as a parameter. 450 kg and 505 kg
313