
Page 689 - Automotive Engineering Powertrain Chassis System and Vehicle Body
P. 689
CHAP TER 2 1. 1 Interior noise: Assessment and control
21.1.3.6 Measurement of sound power
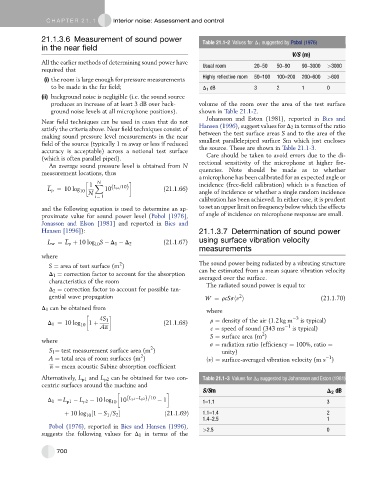
Table 21.1-2 Values for D 1 suggested by Pobol (1976)
in the near field
V/S (m)
All the earlier methods of determining sound power have Usual room 20–50 50–90 90–3000 >3000
required that
(i) the room is large enough for pressure measurements Highly reflective room 50–100 100–200 200–600 >600
to be made in the far field; D 1 dB 3 2 1 0
(ii) background noise is negligible (i.e. the sound source
produces an increase of at least 3 dB over back- volume of the room over the area of the test surface
ground noise levels at all microphone positions). shown in Table 21.1-2.
Johansson and Eston (1981), reported in Bies and
Near field techniques can be used in cases that do not
satisfy the criteria above. Near field techniques consist of Hansen (1996), suggest values for D 2 in terms of the ratio
making sound pressure level measurements in the near between the test surface areas S and to the area of the
field of the source (typically 1 m away or less if reduced smallest parallelepiped surface Sm which just encloses
the source. These are shown in Table 21.1-3.
accuracy is acceptable) across a notional test surface
Care should be taken to avoid errors due to the di-
(which is often parallel piped).
rectional sensitivity of the microphone at higher fre-
An average sound pressure level is obtained from N
measurement locations, thus quencies. Note should be made as to whether
a microphone has been calibrated for an expected angle or
N
1 X incidence (free-field calibration) which is a function of
L p ¼ 10 log 10 10 ðL pi =10Þ (21.1.66)
N angle of incidence or whether a single random incidence
i ¼ 1
calibration has been achieved. In either case, it is prudent
and the following equation is used to determine an ap- to set an upper limit on frequency below which the effects
proximate value for sound power level (Pobol [1976], of angle of incidence on microphone response are small.
Jonasson and Elson [1981] and reported in Bies and
Hansen [1996]): 21.1.3.7 Determination of sound power
L w ¼ L p þ 10 log S D 1 D 2 (21.1.67) using surface vibration velocity
10
measurements
where
2
S ¼ area of test surface (m ) The sound power being radiated by a vibrating structure
D 1 ¼ correction factor to account for the absorption can be estimated from a mean square vibration velocity
averaged over the surface.
characteristics of the room The radiated sound power is equal to:
D 2 ¼ correction factor to account for possible tan-
2
gential wave propagation W ¼ rcSshv i (21.1.70)
D 1 can be obtained from where
4S 1 r ¼ density of the air (1.2 kg m 3 is typical)
D 1 ¼ 10 log 10 1 þ (21.1.68)
Aa c ¼ speed of sound (343 ms 1 is typical)
2
S ¼ surface area (m )
where
s ¼ radiation ratio (efficiency ¼ 100%, ratio ¼
2
S 1 ¼ test measurement surface area (m ) unity)
2
A ¼ total area of room surfaces (m ) CvD ¼ surface-averaged vibration velocity (m s )
1
a ¼ mean acoustic Sabine absorption coefficient
Alternatively, L p1 and L p2 can be obtained for two con- Table 21.1-3 Values for D 2 suggested by Johansson and Eston (1981)
centric surfaces around the machine and
S/Sm D 2 dB
D 1 ¼ L p1 L p2 10 log 10 10 ðL p1 L p2Þ=10 1 1–1.1 3
þ 10 log ½1 S 1 =S 2 ð21:1:69Þ 1.1–1.4 2
10
1.4–2.5 1
Pobol (1976), reported in Bies and Hansen (1996),
suggests the following values for D 1 in terms of the >2.5 0
700