Page 690 - Automotive Engineering Powertrain Chassis System and Vehicle Body
P. 690
Interior noise: Assessment and control    C HAPTER 21.1

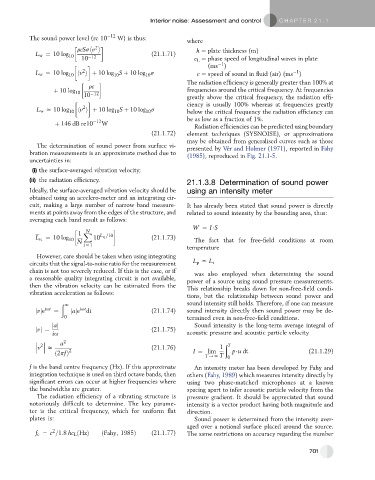
           The sound power level (re 10  12  W) is thus:      where

                          rcSs v 2                               h ¼ plate thickness (m)
             L w ¼ 10 log 10                      (21.1.71)
                            10  12                              c L ¼ phase speed of longitudinal waves in plate
                                                                         1
                                                                     (ms )
                            2
                                                                                                  1
             L w ¼ 10 log 10  hv i þ 10 log S þ 10 log s         c ¼ speed of sound in fluid (air) (ms )
                                      10
                                                 10
                                                              The radiation efficiency is generally greater than 100% at
                              rc
                   þ 10 log 10                                frequencies around the critical frequency. At frequencies
                            10  12                            greatly above the critical frequency, the radiation effi-
                                                              ciency is usually 100% whereas at frequencies greatly
                            2
             L w x 10 log 10  hv i þ 10 log S þ 10 log s      below the critical frequency the radiation efficiency can
                                      10
                                                 10
                                                              be as low as a fraction of 1%.
                                12
                   þ 146 dB re10  W
                                                                Radiation efficiencies can be predicted using boundary
                                                  (21.1.72)   element techniques (SYSNOISE), or approximations
                                                              may be obtained from generalised curves such as those
             The determination of sound power from surface vi-  presented by Ve ´r and Holmer (1971), reported in Fahy
           bration measurements is an approximate method due to  (1985), reproduced in Fig. 21.1-5.
           uncertainties in:
            (i) the surface-averaged vibration velocity;
           (ii) the radiation efficiency.
                                                              21.1.3.8 Determination of sound power
           Ideally, the surface-averaged vibration velocity should be  using an intensity meter
           obtained using an accelero-meter and an integrating cir-
           cuit, making a large number of narrow band measure-  It has already been stated that sound power is directly
           ments at points away from the edges of the structure, and  related to sound intensity by the bounding area, thus:
           averaging each band result as follows:
                             N                                  W ¼ I$S
                           1  X     =10
                ¼ 10 log        10 L v i          (21.1.73)
             L v i     10  N                                    The fact that for free-field conditions at room
                            i ¼ 1
                                                              temperature
             However, care should be taken when using integrating
           circuits that the signal-to-noise ratio for the measurement  L p x L i
           chain is not too severely reduced. If this is the case, or if  was also employed when determining the sound
           a reasonable quality integrating circuit is not available,  power of a source using sound pressure measurements.
           then the vibration velocity can be estimated from the  This relationship breaks down for non-free-field condi-
           vibration acceleration as follows:
                                                              tions, but the relationship between sound power and
                     ð                                        sound intensity still holds. Therefore, if one can measure
                      N
             jvje iut  ¼  jaje iut dt             (21.1.74)   sound intensity directly then sound power may be de-
                      0                                       termined even in non-free-field conditions.
                  jaj                                           Sound intensity is the long-term average integral of
             jvj ¼                                (21.1.75)
                  iu                                          acoustic pressure and acoustic particle velocity
                      2
               2     a                                                    ð T
              v   z     2                         (21.1.76)              1
                   ð2pfÞ                                        I ¼ lim      p$u dt                   (21.1.29)
                                                                    T/N T  0
           f is the band centre frequency (Hz). If this approximate  An intensity meter has been developed by Fahy and
           integration technique is used on third octave bands, then  others (Fahy, 1989) which measures intensity directly by
           significant errors can occur at higher frequencies where  using two phase-matched microphones at a known
           the bandwidths are greater.                        spacing apart to infer acoustic particle velocity from the
             The radiation efficiency of a vibrating structure is  pressure gradient. It should be appreciated that sound
           notoriously difficult to determine. The key parame-  intensity is a vector product having both magnitude and
           ter is the critical frequency, which for uniform flat  direction.
           plates is:                                           Sound power is determined from the intensity aver-
                                                              aged over a notional surface placed around the source.
                  2
             f c ¼ c =1:8 hc L ðHzÞ  ðFahy; 1985Þ  (21.1.77)  The same restrictions on accuracy regarding the number


                                                                                                      701

