Page 707 - Automotive Engineering Powertrain Chassis System and Vehicle Body
P. 707

CHAP TER 2 1. 1       Interior noise: Assessment and control


                                    (a)  100                      (b)  10
                                                           NR
                                                           SRI
                                        90                            9
                                        80                            8
                                                                     Reverberation time (s)
                                        70                            7
                                        60                            6

                                       dB  50                         5
                                        40                            4
                                        30                            3

                                        20                            2
                                        10                            1
                                        0                             0
                                          0   2   4   6   8  10        0   2   4   6   8   10
                                               Frequency (kHz)              Frequency (kHz)
               Fig. 21.1-16 Measured NR and SRI (TL) curves along with reverberation times.


               contiguous 1/3 octave bands between 125 Hz and 4000  21.1.10.4 The significance of acoustic
               Hz inclusive. These measured values are then compared  seals and controlling flanking
               to a family of reference curves as shown in Fig. 21.1-17.  transmission
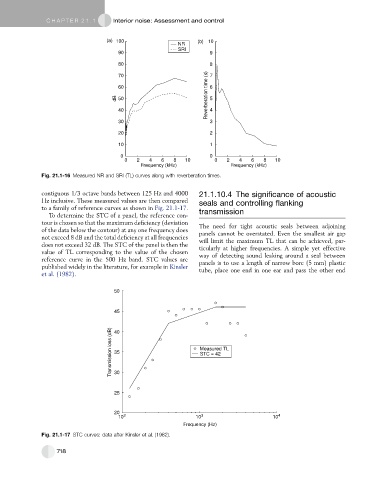
                 To determine the STC of a panel, the reference con-
               tour is chosen so that the maximum deficiency (deviation  The need for tight acoustic seals between adjoining
               of the data below the contour) at any one frequency does  panels cannot be overstated. Even the smallest air gap
               not exceed 8 dB and the total deficiency at all frequencies  will limit the maximum TL that can be achieved, par-
               does not exceed 32 dB. The STC of the panel is then the  ticularly at higher frequencies. A simple yet effective
               value of TL corresponding to the value of the chosen  way of detecting sound leaking around a seal between
               reference curve in the 500 Hz band. STC values are  panels is to use a length of narrow bore (5 mm) plastic
               published widely in the literature, for example in Kinsler  tube, place one end in one ear and pass the other end
               et al. (1982).


                                      50


                                      45


                                     Transmission loss (dB)  40   Measured TL


                                      35
                                                                  STC = 42


                                      30


                                      25


                                      20
                                        10 2                     10 3                     10 4
                                                             Frequency (Hz)
               Fig. 21.1-17 STC curves: data after Kinsler et al. (1982).


                    718
   702   703   704   705   706   707   708   709   710   711   712