
Page 70 - Autonomous Mobile Robots
P. 70
Millimeter Wave RADAR Power-Range Spectra Interpretation 53
(b)
30
25
20
15
Power (dB) 10
5
0
–5
–10
7 8 9 10 11 12 13 14
Range (m)
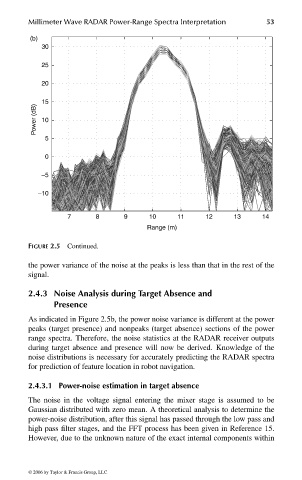
FIGURE 2.5 Continued.
the power variance of the noise at the peaks is less than that in the rest of the
signal.
2.4.3 Noise Analysis during Target Absence and
Presence
As indicated in Figure 2.5b, the power noise variance is different at the power
peaks (target presence) and nonpeaks (target absence) sections of the power
range spectra. Therefore, the noise statistics at the RADAR receiver outputs
during target absence and presence will now be derived. Knowledge of the
noise distributions is necessary for accurately predicting the RADAR spectra
for prediction of feature location in robot navigation.
2.4.3.1 Power-noise estimation in target absence
The noise in the voltage signal entering the mixer stage is assumed to be
Gaussian distributed with zero mean. A theoretical analysis to determine the
power-noise distribution, after this signal has passed through the low pass and
high pass filter stages, and the FFT process has been given in Reference 15.
However, due to the unknown nature of the exact internal components within
© 2006 by Taylor & Francis Group, LLC
FRANKL: “dk6033_c002” — 2006/3/31 — 17:29 — page 53 — #13