
Page 66 - Autonomous Mobile Robots
P. 66
Millimeter Wave RADAR Power-Range Spectra Interpretation 49
30
Returns from objects
25
High pass filter gain model
20
15
Power (dB) 10
5
0
–5
–10
–15
0 20 40 60 80 100 120 140 160 180 200
Range (m)
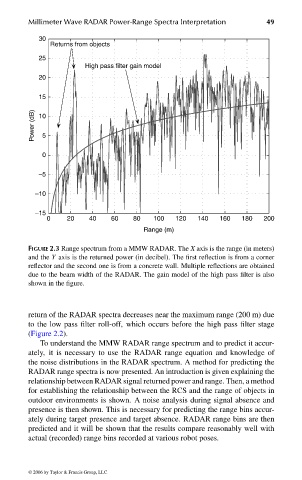
FIGURE 2.3 Range spectrum from a MMW RADAR. The X axis is the range (in meters)
and the Y axis is the returned power (in decibel). The first reflection is from a corner
reflector and the second one is from a concrete wall. Multiple reflections are obtained
due to the beam width of the RADAR. The gain model of the high pass filter is also
shown in the figure.
return of the RADAR spectra decreases near the maximum range (200 m) due
to the low pass filter roll-off, which occurs before the high pass filter stage
(Figure 2.2).
To understand the MMW RADAR range spectrum and to predict it accur-
ately, it is necessary to use the RADAR range equation and knowledge of
the noise distributions in the RADAR spectrum. A method for predicting the
RADAR range spectra is now presented. An introduction is given explaining the
relationship between RADAR signal returned power and range. Then, a method
for establishing the relationship between the RCS and the range of objects in
outdoor environments is shown. A noise analysis during signal absence and
presence is then shown. This is necessary for predicting the range bins accur-
ately during target presence and target absence. RADAR range bins are then
predicted and it will be shown that the results compare reasonably well with
actual (recorded) range bins recorded at various robot poses.
© 2006 by Taylor & Francis Group, LLC
FRANKL: “dk6033_c002” — 2006/3/31 — 17:29 — page 49 — #9