Page 145 - Basics of MATLAB and Beyond
P. 145

x = linspace(0,1,200);
                               y = humps(x);
                               subplot(221)
                               plt(x,y)
                               text(.5,1,’Scale = 1’,...
                                   ’units’,’normalized’)
                               subplot(222)
                               plt(x/7,y/7)
                               text(.5,1,’Scale = 1/7’,...
                                   ’units’,’normalized’)
                               Notice that the text commands here use the same positional references,
                               being x =0.5 and y = 1 in normalized units.
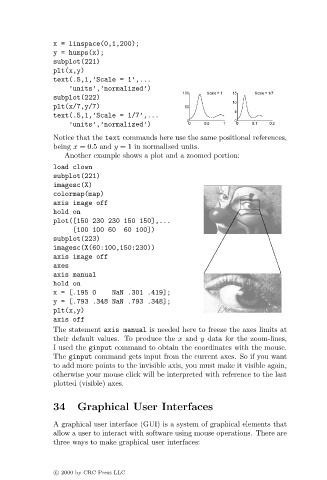
                                  Another example shows a plot and a zoomed portion:
                               load clown
                               subplot(221)
                               imagesc(X)
                               colormap(map)
                               axis image off
                               hold on
                               plot([150 230 230 150 150],...
                                    [100 100 60   60 100])
                               subplot(223)
                               imagesc(X(60:100,150:230))
                               axis image off
                               axes
                               axis manual
                               hold on
                               x = [.195 0     NaN .301 .419];
                               y = [.793 .348 NaN .793 .348];
                               plt(x,y)
                               axis off
                               The statement axis manual is needed here to freeze the axes limits at
                               their default values. To produce the x and y data for the zoom-lines,
                               I used the ginput command to obtain the coordinates with the mouse.
                               The ginput command gets input from the current axes. So if you want
                               to add more points to the invisible axis, you must make it visible again,
                               otherwise your mouse click will be interpreted with reference to the last
                               plotted (visible) axes.


                               34    Graphical User Interfaces

                               A graphical user interface (GUI) is a system of graphical elements that
                               allow a user to interact with software using mouse operations. There are
                               three ways to make graphical user interfaces:


                               c   2000 by CRC Press LLC
   140   141   142   143   144   145   146   147   148   149   150