
Page 140 - Basics of MATLAB and Beyond
P. 140
property to [0 top] in the call to the axes command (the x scales are
the same here). The if statement containing the test count<6 ensures
that only the plots in the top row—plot numbers 1, 2,..., 5—produce
the text (created using text commands) on the top row of plots, which
indicate the time values for each column. The if statement containing
the test rem(count-1,5) = = 0 ensures that only the plots in the left
column—plot numbers 1, 6, 11,... , 51—produce the text indicating the
y values for each row.
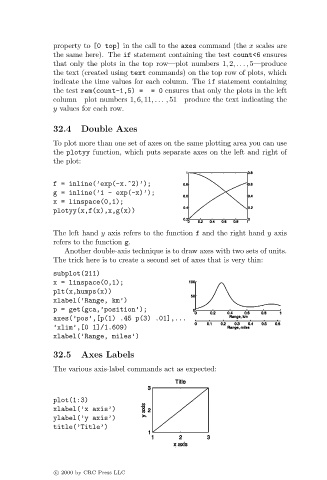
32.4 Double Axes
To plot more than one set of axes on the same plotting area you can use
the plotyy function, which puts separate axes on the left and right of
the plot:
f = inline(’exp(-x.^2)’);
g = inline(’1 - exp(-x)’);
x = linspace(0,1);
plotyy(x,f(x),x,g(x))
The left hand y axis refers to the function f and the right hand y axis
refers to the function g.
Another double-axis technique is to draw axes with two sets of units.
The trick here is to create a second set of axes that is very thin:
subplot(211)
x = linspace(0,1);
plt(x,humps(x))
xlabel(’Range, km’)
p = get(gca,’position’);
axes(’pos’,[p(1) .45 p(3) .01],...
’xlim’,[0 1]/1.609)
xlabel(’Range, miles’)
32.5 Axes Labels
The various axis-label commands act as expected:
plot(1:3)
xlabel(’x axis’)
ylabel(’y axis’)
title(’Title’)
c 2000 by CRC Press LLC