Page 139 - Basics of MATLAB and Beyond
P. 139

for yi = 1:Ny
                                 for ti = 1:Nt
                                   count = count + 1;
                                   pos = pickbox(Ny,Nt,count,0,0,.2);
                                   ax = axes(’pos’,pos,...
                                       ’ylim’,[0top],...
                                       ’nextplot’,’add’,...
                                       ’visible’,’off’);
                                   plt(xv,B(:,yi,ti),’.’) % Data
                                   plt([-1 -1 1],[1 00],’k:’) % Dotted frame
                                   if count~ = 51
                                     set(gca,’xticklabel’,’’,...
                                        ’yticklabel’,’’)
                                   end
                                   if count  =  =  51
                                     axis on
                                     xlabel(’x’)
                                     ylabel(’B’)
                                   end
                                   if count<6
                                     text(0,1.2,[’Time = ’ ...
                                          num2str(tv(ti)) ’ s’],...
                                        ’HorizontalAlignment’,’center’)
                                   end
                                   if rem(count-1,5) =  = 0
                                     text(-3,0.5,[’y = ’ ...
                                          num2str(yv(yi))])
                                   end
                                 end
                               end


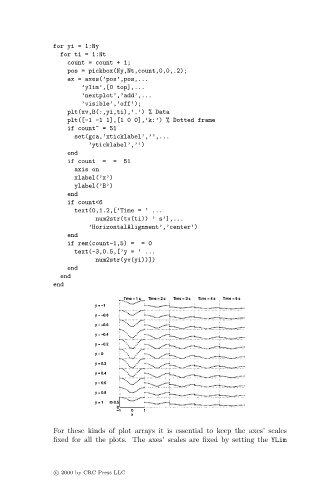
                               For these kinds of plot arrays it is essential to keep the axes’ scales
                               fixed for all the plots. The axes’ scales are fixed by setting the YLim


                               c   2000 by CRC Press LLC
   134   135   136   137   138   139   140   141   142   143   144