
Page 137 - Basics of MATLAB and Beyond
P. 137
The tick labels can be either numbers or strings. You have a choice of
the following formats:
set(gca,’XTickLabel’,{’1’;’10’;’100’}
set(gca,’XTickLabel’,’1|10|100’)
set(gca,’XTickLabel’,[1;10;100])
set(gca,’XTickLabel’,0:2)
set(gca,’XTickLabel’,[’1 ’;’10 ’;’100’])
In the second format, the modulus signs “|” separate the tick labels. In
the fifth format you cannot replace the semicolons by commas; if you do
you will be specifying a single tick label equal to the string ‘1 10 100’,
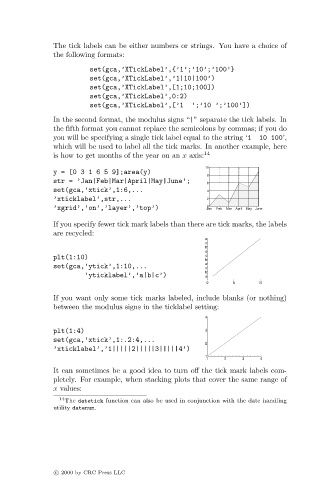
which will be used to label all the tick marks. In another example, here
is how to get months of the year on an x axis: 14
10
y = [0 31 6 5 9];area(y)
8
str = ’Jan|Feb|Mar|April|May|June’; 6
set(gca,’xtick’,1:6,... 4
’xticklabel’,str,... 2
’xgrid’,’on’,’layer’,’top’) 0 Jan Feb Mar April May June
If you specify fewer tick mark labels than there are tick marks, the labels
are recycled:
a
c
b
a
plt(1:10) c b
a
set(gca,’ytick’,1:10,... c
b
’yticklabel’,’a|b|c’) a
0 5 10
If you want only some tick marks labeled, include blanks (or nothing)
between the modulus signs in the ticklabel setting:
4
plt(1:4) 3
set(gca,’xtick’,1:.2:4,...
2
’xticklabel’,’1|||||2|||||3|||||4’)
1
1 2 3 4
It can sometimes be a good idea to turn off the tick mark labels com-
pletely. For example, when stacking plots that cover the same range of
x values:
14 The datetick function can also be used in conjunction with the date handling
utility datenum.
c 2000 by CRC Press LLC