Page 133 - Basics of MATLAB and Beyond
P. 133

Some new data now:
                                                            60
                               t = linspace(0,1);
                                                            40
                               x = humps(t);
                                                            20
                               y = humps(t.^2)/2;
                               plot(x,y)                     0 0  50   100
                               The Axes limits have been set to the next round number in the series of
                               tick marks. To change the scale so that the data fill the whole plot:

                                                           40
                               axis tight                  30
                                                           20
                                                           10
                                                              20  40  60  80
                               To zoom in on the loop:
                                                           12
                                                           10
                               axis([10 25 5 12])          8
                                                           6
                                                            10  15  20  25
                               To zoom back out again: 12
                                                           60
                                                           40
                               axis auto                   20
                                                           0
                                                            0    50   100
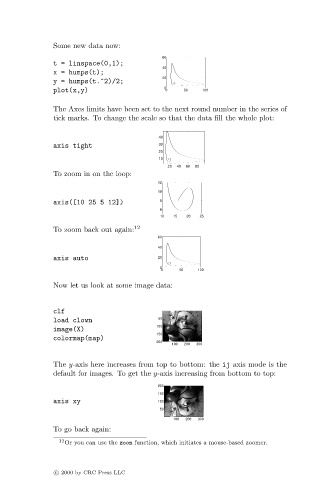
                               Now let us look at some image data:


                               clf
                               load clown                  50
                                                           100
                               image(X)
                                                           150
                               colormap(map)
                                                           200
                                                               100  200  300
                               The y-axis here increases from top to bottom: the ij axis mode is the
                               default for images. To get the y-axis increasing from bottom to top:

                                                           200
                                                           150
                               axis xy                     100
                                                           50
                                                               100  200  300
                               To go back again:
                                12 Or you can use the zoom function, which initiates a mouse-based zoomer.


                               c   2000 by CRC Press LLC
   128   129   130   131   132   133   134   135   136   137   138