
Page 136 - Basics of MATLAB and Beyond
P. 136
32.2 Tick Marks and Labels
matlab’s default behaviour regarding tick marks is to put a reasonable
number of ticks at evenly spaced, round number increments that at least
span the data. You can change the tick marks using the various tickmark
properties:
XTick = [1 2 34 5] TickLength = [0.01 0.025]
XTickLabel [’a|b|c|d|e’] TickDir = in
XTickLabelMode = manual TickDirMode = auto
XTickMode = manual
The properties in the first column have equivalents for the y and z axes;
the properties in the second column affect the ticks on all axes.
The TickLength property must be set to a two-element vector;
the first element is the length of tickmarks used for two-dimensional
plots and the second element is the length of tickmarks used for three-
dimensional plots. The units are normalised to the length of the longest
axis:
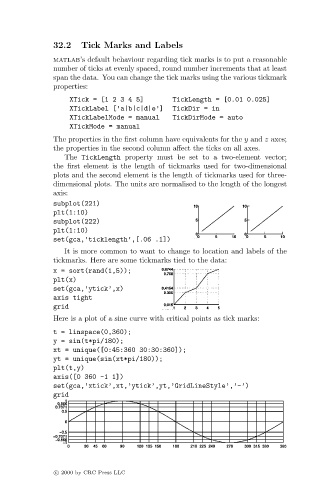
subplot(221)
plt(1:10)
subplot(222)
plt(1:10)
set(gca,’ticklength’,[.06 .1])
It is more common to want to change to location and labels of the
tickmarks. Here are some tickmarks tied to the data:
x = sort(rand(1,5));
plt(x)
set(gca,’ytick’,x)
axis tight
grid
Here is a plot of a sine curve with critical points as tick marks:
t = linspace(0,360);
y = sin(t*pi/180);
xt = unique([0:45:360 30:30:360]);
yt = unique(sin(xt*pi/180));
plt(t,y)
axis([0 360 -1 1])
set(gca,’xtick’,xt,’ytick’,yt,’GridLineStyle’,’-’)
grid
c 2000 by CRC Press LLC