
Page 148 - Basics of MATLAB and Beyond
P. 148
uicontrol(’Callback’,’ezplot(’’sin(x)’’)’, ...
’Position’,[508 351 51 26],’String’,’Sine’);
uicontrol(’Callback’,’ezplot(’’cos(x)’’)’, ...
’Position’,[508 322 51 26],’String’,’Cos’);
uicontrol(’Callback’,’ezplot(’’tan(x)’’)’, ...
’Position’,[508 29351 26],’String’,’Tan’);
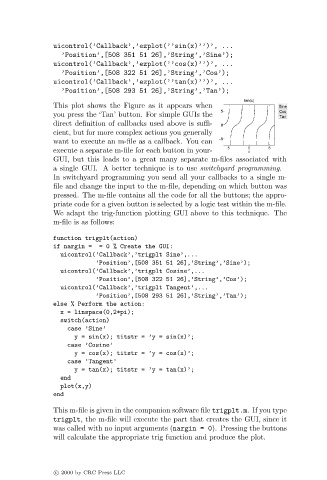
This plot shows the Figure as it appears when
you press the ‘Tan’ button. For simple GUIs the
direct definition of callbacks used above is suffi-
cient, but for more complex actions you generally
want to execute an m-file as a callback. You can
execute a separate m-file for each button in your-
GUI, but this leads to a great many separate m-files associated with
a single GUI. A better technique is to use switchyard programming.
In switchyard programming you send all your callbacks to a single m-
file and change the input to the m-file, depending on which button was
pressed. The m-file contains all the code for all the buttons; the appro-
priate code for a given button is selected by a logic test within the m-file.
We adapt the trig-function plotting GUIabove to this technique. The
m-file is as follows:
function trigplt(action)
if nargin = = 0% Create the GUI:
uicontrol(’Callback’,’trigplt Sine’,...
’Position’,[508 351 51 26],’String’,’Sine’);
uicontrol(’Callback’,’trigplt Cosine’,...
’Position’,[508 322 51 26],’String’,’Cos’);
uicontrol(’Callback’,’trigplt Tangent’,...
’Position’,[508 293 51 26],’String’,’Tan’);
else % Perform the action:
x = linspace(0,2*pi);
switch(action)
case ’Sine’
y = sin(x); titstr = ’y = sin(x)’;
case ’Cosine’
y = cos(x); titstr = ’y = cos(x)’;
case ’Tangent’
y = tan(x); titstr = ’y = tan(x)’;
end
plot(x,y)
end
This m-file is given in the companion software file trigplt.m.If you type
trigplt, the m-file will execute the part that creates the GUI, since it
was called with no input arguments (nargin = 0). Pressing the buttons
will calculate the appropriate trig function and produce the plot.
c 2000 by CRC Press LLC