
Page 61 - Basics of MATLAB and Beyond
P. 61
display the resulting fit to the data by calculating the parabola. We
use matrix multiplication to calculate the polynomial over a fine set of
points separated by half a year:
year_fine = (year(1):0.5:year(length(year)))’;
Pfine = [ones(size(year_fine)) year_fine year_fine.^2]*C;
plot(year,P,’o’,...
year_fine,Pfine)
This technique can be used to fit any function that is linear in its
parameters. (matlab provides the functions polyfit and polyval as
easy interfaces to the functionality that we have just illustrated using
matrix multiplication and division.)
Exercise 4 Use this technique to fit an exponential curve to the
population data. Hint: Take logs. (Answer on page 183.)
15 Missing Data
Real-world measurements are often taken at regular intervals; for exam-
ple, the position of a comet in the sky measured each night, or the depth
of the sea along a line at 1 metre increments. Environmental effects or
equipment failure (a cloudy night or a failed depth meter) sometimes
result in a set of data that has missing values. In matlab these can be
represented by NaN, which stands for “not-a-number”. NaN is also given
by matlab as the result of undefined calculations such as 0/0. matlab
handles NaNs by setting the result of any calculation that involves NaNs
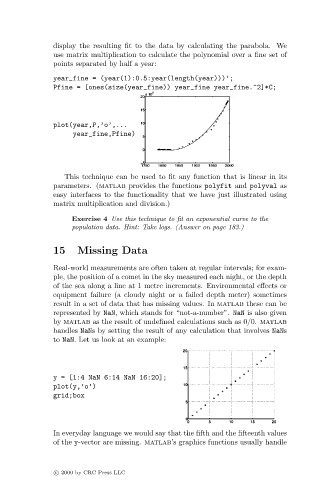
to NaN. Let us look at an example:
y = [1:4 NaN 6:14 NaN 16:20];
plot(y,’o’)
grid;box
In everyday language we would say that the fifth and the fifteenth values
of the y-vector are missing. matlab’s graphics functions usually handle
c 2000 by CRC Press LLC