
Page 62 - Basics of MATLAB and Beyond
P. 62
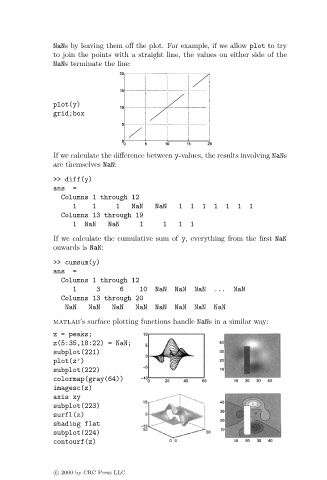
NaNs by leaving them off the plot. For example, if we allow plot to try
                               to join the points with a straight line, the values on either side of the
                               NaNs terminate the line:


                               plot(y)
                               grid;box


                               If we calculate the difference between y-values, the results involving NaNs
                               are themselves NaN:

                               >> diff(y)
                               ans  =
                                 Columns 1 through 12
                                    1    1      1   NaN   NaN   1   1  1  1  1  1  1
                                 Columns 13 through 19
                                    1  NaN    NaN     1     1   1   1
                               If we calculate the cumulative sum of y, everything from the first NaN
                               onwards is NaN:

                               >> cumsum(y)
                               ans  =
                                 Columns 1 through 12
                                    1     3      6    10  NaN  NaN   NaN  ...  NaN
                                 Columns 13 through 20
                                  NaN   NaN    NaN   NaN  NaN  NaN   NaN  NaN

                               matlab’s surface plotting functions handle NaNs in a similar way:
                               z = peaks;
                               z(5:35,18:22) = NaN;
                               subplot(221)
                               plot(z’)
                               subplot(222)
                               colormap(gray(64))
                               imagesc(z)
                               axis xy
                               subplot(223)
                               surfl(z)
                               shading flat
                               subplot(224)
                               contourf(z)


                               c   2000 by CRC Press LLC