
Page 67 - Basics of MATLAB and Beyond
P. 67
The top trace in the top plot is the noisy data, and the bottom trace is
the original pure sinusoid. The lower plot clearly shows the frequency at
100 Hz.
Two GUI-based FFT demos can be accessed by typing demo at the
prompt. Select the “Signal Processing” option, then choose the “Discrete
Fourier Transform” or the “Continuous Fourier Transform”.
Exercise 5 Extend the ideas in the previous example to two
dimensions, as would be the case, for example, if you made mea-
surements in space and time, rather than time alone. Gener-
ate a two-dimensional sinusoid and explore its FFT. (Answer on
page 185.)
18 Power Spectrum
The power spectrum (or power spectral density, or PSD) is a measure
of the power contained within frequency intervals. The problem is that
we only have a finite set of samples of the true signal so we can never
have perfect knowledge about its power spectrum. A common way to
estimate a PSD is to use the square of the FFT of the samples. The
square of the FFT is called the periodogram. The workhorse of mat-
lab’s periodogram-based spectral estimation is the spectrum function
(in the Signal Processing Toolbox). We illustrate using data similar to
the previous example of a noisy sinusoid, but we take more samples. A
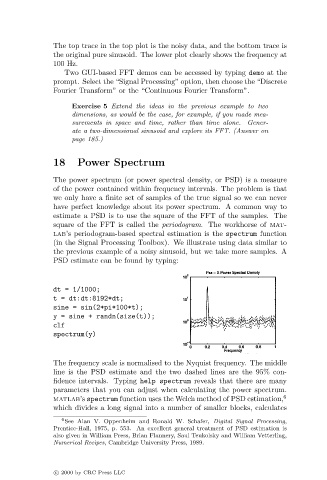
PSD estimate can be found by typing:
dt = 1/1000;
t = dt:dt:8192*dt;
sine = sin(2*pi*100*t);
y = sine + randn(size(t));
clf
spectrum(y)
The frequency scale is normalised to the Nyquist frequency. The middle
line is the PSD estimate and the two dashed lines are the 95% con-
fidence intervals. Typing help spectrum reveals that there are many
parameters that you can adjust when calculating the power spectrum.
matlab’s spectrum function uses the Welch method of PSD estimation, 6
which divides a long signal into a number of smaller blocks, calculates
6 See Alan V. Oppenheim and Ronald W. Schafer, Digital Signal Processing,
Prentice-Hall, 1975, p. 553. An excellent general treatment of PSD estimation is
also given in William Press, Brian Flannery, Saul Teukolsky and William Vetterling,
Numerical Recipes, Cambridge University Press, 1989.
c 2000 by CRC Press LLC