
Page 71 - Basics of MATLAB and Beyond
P. 71
Exercise 6 Try a more complicated modulation function; for
example, a sinusoidal rather than a linear frequency variation.
Try plotting the results as a surface instead of an image. (Answer
on page 186.)
21 Line Animation
matlab’s comet function can be used to produce an animation on the
screen of a trajectory through either two-space or three-space. For exam-
ple, we use some recorded aircraft GPS data in the file gps.mat.
>> clear
>> load gps
>> whos
Name Size Bytes Class
t 500x1 4000 double array
x 500x1 4000 double array
y 500x1 4000 double array
z 500x1 4000 double array
Grand total is 2000 elements using 16000 bytes
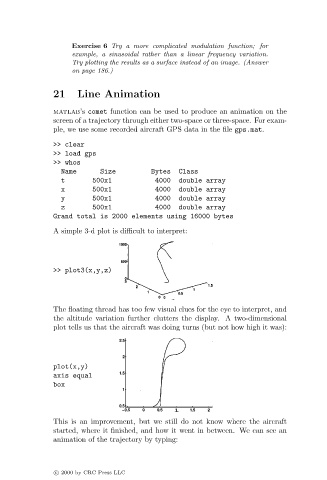
A simple 3-d plot is difficult to interpret:
>> plot3(x,y,z)
The floating thread has too few visual clues for the eye to interpret, and
the altitude variation further clutters the display. A two-dimensional
plot tells us that the aircraft was doing turns (but not how high it was):
plot(x,y)
axis equal
box
This is an improvement, but we still do not know where the aircraft
started, where it finished, and how it went in between. We can see an
animation of the trajectory by typing:
c c 2000 by CRC Press LLC