
Page 74 - Basics of MATLAB and Beyond
P. 74
By clicking within the panner box and dragging, you can change the
location of the zoomed window. You can listen to this time series by
selecting Options→Play.
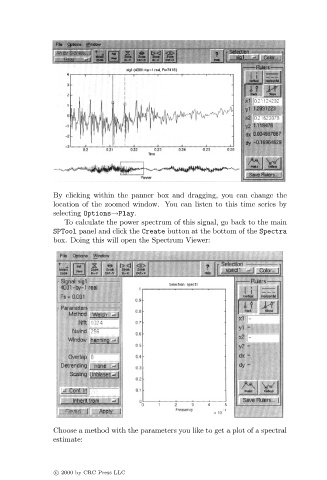
To calculate the power spectrum of this signal, go back to the main
SPTool panel and click the Create button at the bottom of the Spectra
box. Doing this will open the Spectrum Viewer:
Choose a method with the parameters you like to get a plot of a spectral
estimate:
c 2000 by CRC Press LLC