
Page 77 - Basics of MATLAB and Beyond
P. 77
23.1 Custom Plotting Functions
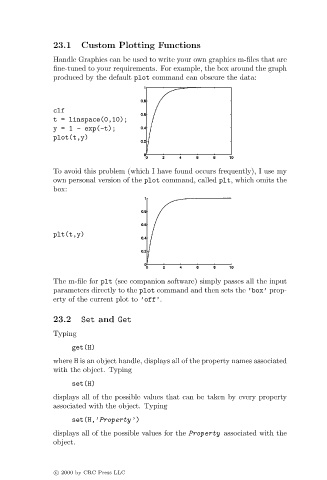
Handle Graphics can be used to write your own graphics m-files that are
fine-tuned to your requirements. For example, the box around the graph
produced by the default plot command can obscure the data:
clf
t = linspace(0,10);
y=1- exp(-t);
plot(t,y)
To avoid this problem (which I have found occurs frequently), I use my
own personal version of the plot command, called plt, which omits the
box:
plt(t,y)
The m-file for plt (see companion software) simply passes all the input
parameters directly to the plot command and then sets the ’box’ prop-
erty of the current plot to ’off’.
23.2 Set and Get
Typing
get(H)
where H is an object handle, displays all of the property names associated
with the object. Typing
set(H)
displays all of the possible values that can be taken by every property
associated with the object. Typing
set(H,’Property ’)
displays all of the possible values for the Property associated with the
object.
c 2000 by CRC Press LLC