
Page 72 - Basics of MATLAB and Beyond
P. 72
comet(x,y)
(You can get a three-dimensional version by using comet3.) You can see
it on your screen. But we have just illustrated a disadvantage of such
a display: you have to be there. I cannot communicate to you what
it looks like on paper. For that you need to resort to, say, an array of
two-dimensional plots strung out along the third time dimension. This
gets us into the subject of plot arrays, which is discussed in Section 32.3
on page 123.
22 SPTool
SPTool (in the Signal Processing Toolbox) is a graphical user interface
to many of matlab’s signal processing functions. The idea is to import
signals from the matlab workspace into the SPTool environment where
they can be manipulated in a great variety of ways. As an example, load
some data into your workspace by typing:
load mtlb
We will use SPTool to look at this time-series data and calculate various
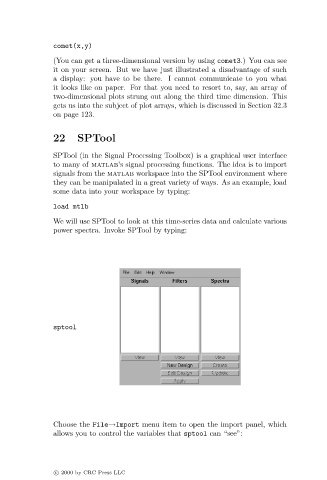
power spectra. Invoke SPTool by typing:
sptool
Choose the File→Import menu item to open the import panel, which
allows you to control the variables that sptool can “see”:
c 2000 by CRC Press LLC