
Page 73 - Basics of MATLAB and Beyond
P. 73
Click on the variable mtlb and the arrow button (-->) to get mtlb to
appear in the Data box (or just type mtlb there). Do the same to make
Fs appear in the Sampling box. Then press OK. A signal called sig1
appears in the Signals box in the main SPTool panel. Clicking on the
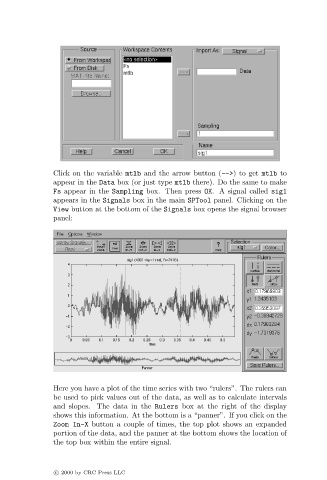
View button at the bottom of the Signals box opens the signal browser
panel:
Here you have a plot of the time series with two “rulers”. The rulers can
be used to pick values out of the data, as well as to calculate intervals
and slopes. The data in the Rulers box at the right of the display
shows this information. At the bottom is a “panner”. If you click on the
Zoom In-X button a couple of times, the top plot shows an expanded
portion of the data, and the panner at the bottom shows the location of
the top box within the entire signal.
c 2000 by CRC Press LLC