
Page 78 - Basics of MATLAB and Beyond
P. 78
23.3 Graphical Object Hierarchy
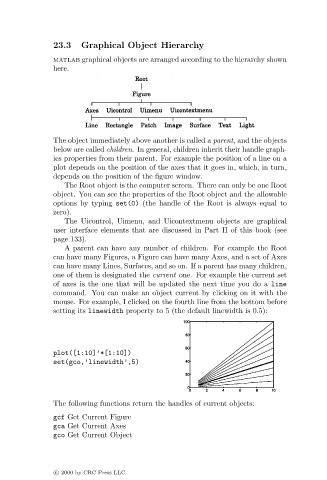
matlab graphical objects are arranged according to the hierarchy shown
here.
The object immediately above another is called a parent, and the objects
below are called children. In general, children inherit their handle graph-
ics properties from their parent. For example the position of a line on a
plot depends on the position of the axes that it goes in, which, in turn,
depends on the position of the figure window.
The Root object is the computer screen. There can only be one Root
object. You can see the properties of the Root object and the allowable
options by typing set(0) (the handle of the Root is always equal to
zero).
The Uicontrol, Uimenu, and Uicontextmenu objects are graphical
user interface elements that are discussed in Part II of this book (see
page 133).
A parent can have any number of children. For example the Root
can have many Figures, a Figure can have many Axes, and a set of Axes
can have many Lines, Surfaces, and so on. If a parent has many children,
one of them is designated the current one. For example the current set
of axes is the one that will be updated the next time you do a line
command. You can make an object current by clicking on it with the
mouse. For example, I clicked on the fourth line from the bottom before
setting its linewidth property to 5 (the default linewidth is 0.5):
plot([1:10]’*[1:10])
set(gco,’linewidth’,5)
The following functions return the handles of current objects:
gcf Get Current Figure
gca Get Current Axes
gco Get Current Object
c 2000 by CRC Press LLC