
Page 228 - Becoming Metric Wise
P. 228
219
Indicators
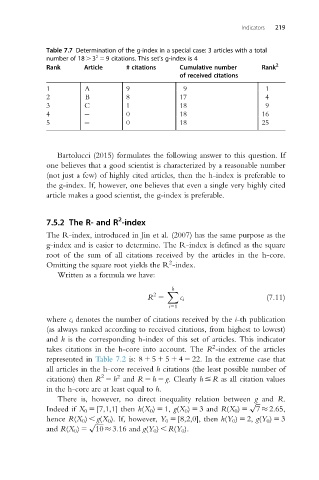
Table 7.7 Determination of the g-index in a special case: 3 articles with a total
2
number of 18 . 3 5 9 citations. This set’s g-index is 4
Rank Article # citations Cumulative number Rank 2
of received citations
1 A 9 9 1
2 B 8 17 4
3 C 1 18 9
4 0 18 16
5 0 18 25
Bartolucci (2015) formulates the following answer to this question. If
one believes that a good scientist is characterized by a reasonable number
(not just a few) of highly cited articles, then the h-index is preferable to
the g-index. If, however, one believes that even a single very highly cited
article makes a good scientist, the g-index is preferable.
2
7.5.2 The R- and R -index
The R-index, introduced in Jin et al. (2007) has the same purpose as the
g-index and is easier to determine. The R-index is defined as the square
root of the sum of all citations received by the articles in the h-core.
2
Omitting the square root yields the R -index.
Written as a formula we have:
h
X
2
R 5 c i (7.11)
i51
where c i denotes the number of citations received by the i-th publication
(as always ranked according to received citations, from highest to lowest)
and h is the corresponding h-index of this set of articles. This indicator
2
takes citations in the h-core into account. The R -index of the articles
represented in Table 7.2 is: 8 1 5 1 5 1 4 5 22. In the extreme case that
all articles in the h-core received h citations (the least possible number of
2 2
citations) then R 5 h and R 5 h 5 g. Clearly h # R as all citation values
in the h-core are at least equal to h.
There is, however, no direct inequality relation between g and R.
p ffiffiffi
Indeed if X 0 5 [7,1,1] then h(X 0 ) 5 1, g(X 0 ) 5 3 and R(X 0 ) 5 7 2.65,
hence R(X 0 ) , g(X 0 ). If, however, Y 0 5 [8,2,0], then h(Y 0 ) 5 2, g(Y 0 ) 5 3
p ffiffiffiffiffi
and R(X 0 ) 5 10 3.16 and g(Y 0 ) , R(Y 0 ).