
Page 306 - Becoming Metric Wise
P. 306
298 Becoming Metric-Wise
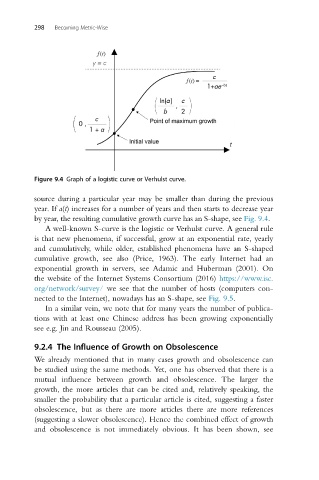
Figure 9.4 Graph of a logistic curve or Verhulst curve.
source during a particular year may be smaller than during the previous
year. If a(t) increases for a number of years and then starts to decrease year
by year, the resulting cumulative growth curve has an S-shape, see Fig. 9.4.
A well-known S-curve is the logistic or Verhulst curve. A general rule
is that new phenomena, if successful, grow at an exponential rate, yearly
and cumulatively, while older, established phenomena have an S-shaped
cumulative growth, see also (Price, 1963). The early Internet had an
exponential growth in servers, see Adamic and Huberman (2001). On
the website of the Internet Systems Consortium (2016) https://www.isc.
org/network/survey/ we see that the number of hosts (computers con-
nected to the Internet), nowadays has an S-shape, see Fig. 9.5.
In a similar vein, we note that for many years the number of publica-
tions with at least one Chinese address has been growing exponentially
see e.g. Jin and Rousseau (2005).
9.2.4 The Influence of Growth on Obsolescence
We already mentioned that in many cases growth and obsolescence can
be studied using the same methods. Yet, one has observed that there is a
mutual influence between growth and obsolescence. The larger the
growth, the more articles that can be cited and, relatively speaking, the
smaller the probability that a particular article is cited, suggesting a faster
obsolescence, but as there are more articles there are more references
(suggesting a slower obsolescence). Hence the combined effect of growth
and obsolescence is not immediately obvious. It has been shown, see