
Page 97 - Becoming Metric Wise
P. 97
87
Statistics
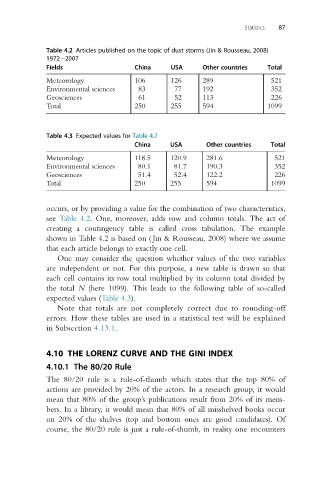
Table 4.2 Articles published on the topic of dust storms (Jin & Rousseau, 2008)
1972 2007
Fields China USA Other countries Total
Meteorology 106 126 289 521
Environmental sciences 83 77 192 352
Geosciences 61 52 113 226
Total 250 255 594 1099
Table 4.3 Expected values for Table 4.2
China USA Other countries Total
Meteorology 118.5 120.9 281.6 521
Environmental sciences 80.1 81.7 190.3 352
Geosciences 51.4 52.4 122.2 226
Total 250 255 594 1099
occurs, or by providing a value for the combination of two characteristics,
see Table 4.2. One, moreover, adds row and column totals. The act of
creating a contingency table is called cross tabulation. The example
shown in Table 4.2 is based on ( Jin & Rousseau, 2008) where we assume
that each article belongs to exactly one cell.
One may consider the question whether values of the two variables
are independent or not. For this purpose, a new table is drawn so that
each cell contains its row total multiplied by its column total divided by
the total N (here 1099). This leads to the following table of so-called
expected values (Table 4.3).
Note that totals are not completely correct due to rounding-off
errors. How these tables are used in a statistical test will be explained
in Subsection 4.13.1.
4.10 THE LORENZ CURVE AND THE GINI INDEX
4.10.1 The 80/20 Rule
The 80/20 rule is a rule-of-thumb which states that the top 80% of
actions are provided by 20% of the actors. In a research group, it would
mean that 80% of the group’s publications result from 20% of its mem-
bers. In a library, it would mean that 80% of all misshelved books occur
on 20% of the shelves (top and bottom ones are good candidates). Of
course, the 80/20 rule is just a rule-of-thumb, in reality one encounters