
Page 93 - Becoming Metric Wise
P. 93
83
Statistics
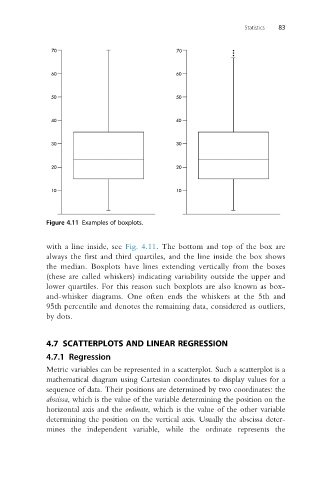
Figure 4.11 Examples of boxplots.
with a line inside, see Fig. 4.11. The bottom and top of the box are
always the first and third quartiles, and the line inside the box shows
the median. Boxplots have lines extending vertically from the boxes
(these are called whiskers) indicating variability outside the upper and
lower quartiles. For this reason such boxplots are also known as box-
and-whisker diagrams. One often ends the whiskers at the 5th and
95th percentile and denotes the remaining data, considered as outliers,
by dots.
4.7 SCATTERPLOTS AND LINEAR REGRESSION
4.7.1 Regression
Metric variables can be represented in a scatterplot. Such a scatterplot is a
mathematical diagram using Cartesian coordinates to display values for a
sequence of data. Their positions are determined by two coordinates: the
abscissa, which is the value of the variable determining the position on the
horizontal axis and the ordinate, which is the value of the other variable
determining the position on the vertical axis. Usually the abscissa deter-
mines the independent variable, while the ordinate represents the