
Page 91 - Becoming Metric Wise
P. 91
81
Statistics
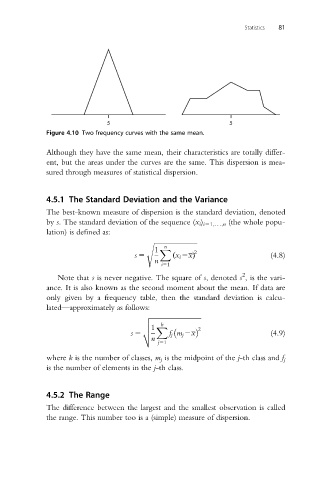
Figure 4.10 Two frequency curves with the same mean.
Although they have the same mean, their characteristics are totally differ-
ent, but the areas under the curves are the same. This dispersion is mea-
sured through measures of statistical dispersion.
4.5.1 The Standard Deviation and the Variance
The best-known measure of dispersion is the standard deviation, denoted
by s. The standard deviation of the sequence (x i ) i51,.. .,n (the whole popu-
lation) is defined as:
s ffiffiffiffiffiffiffiffiffiffiffiffiffiffiffiffiffiffiffiffiffiffiffiffiffiffi
n
1 X
s 5 ð x i 2xÞ 2 (4.8)
n
i51
2
Note that s is never negative. The square of s, denoted s , is the vari-
ance. It is also known as the second moment about the mean. If data are
only given by a frequency table, then the standard deviation is calcu-
lated—approximately as follows:
v ffiffiffiffiffiffiffiffiffiffiffiffiffiffiffiffiffiffiffiffiffiffiffiffiffiffiffiffiffiffi
u k
1
u X 2
s 5 t f j m j 2x (4.9)
n
j51
where k is the number of classes, m j is the midpoint of the j-th class and f j
is the number of elements in the j-th class.
4.5.2 The Range
The difference between the largest and the smallest observation is called
the range. This number too is a (simple) measure of dispersion.