
Page 107 - Biaxial Multiaxial Fatigue and Fracture
P. 107
92 L. SUSMEL AND N. PETRONE
In Figure 7l the bi-dimensional development of gauge surface of specimens subjected to fully-
reversed bending have been reported and, on each single surface, one of the two detected fatigue
cracks has been drawn. The crack final patterns were obtained by interrupting tests when the
bending stiffness drop was equal to 20%. By observing this figure it is possible to notice that the
crack growth were mainly MODE I dominated and the cracking pattern was not influenced by the
applied stress amplitude, that is, it was independent from the number of cycle to failure.
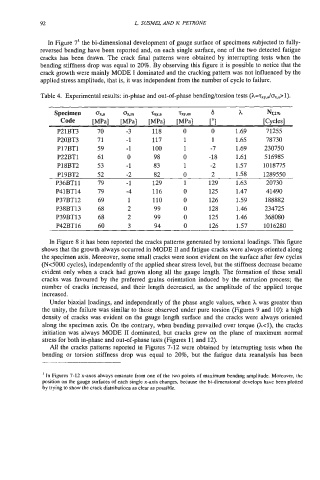
Table 4. Experimental results: in-phase and out-of-phase bendingkorsion tests (A.=txy,Jox,a>l).
Code [MPa] [MPa] [MPa] [MPa] ["I [Cycles]
P21BT3 70 -3 118 0 0 1.69 71255
P20BT3 71 -1 117 1 1 1.65 78730
P17BTl 59 -1 100 1 -7 1.69 230750
P22BT1 61 0 98 0 -18 1.61 516985
P18BT2 53 -1 83 1 -2 1.57 1018775
P19BT2 52 -2 82 0 2 1.58 1289550
P36BTll 79 -1 129 1 129 1.63 20730
P41BT14 79 -4 116 0 125 1.47 41490
P37BT12 69 1 110 0 126 1.59 188882
P38BT13 68 2 99 0 128 1.46 234725
P39BT13 68 2 99 0 125 1.46 368080
P42BT16 60 3 94 0 126 1.57 1016280
In Figure 8 it has been reported the cracks patterns generated by torsional loadings. This figure
shows that the growth always occurred in MODE I1 and fatigue cracks were always oriented along
the specimen axis. Moreover, some small cracks were soon evident on the surface after few cycles
(Nc.5000 cycles), independently of the applied shear stress level, but the stiffness decrease became
evident only when a crack had grown along all the gauge length. The formation of these small
cracks was favoured by the preferred grains orientation induced by the extrusion process; the
number of cracks increased, and their length decreased, as the amplitude of the applied torque
increased.
Under biaxial loadings, and independently of the phase angle values, when h was greater than
the unity, the failure was similar to those observed under pure torsion (Figures 9 and 10): a high
density of cracks was evident on the gauge length surface and the cracks were always oriented
along the specimen axis. On the contrary, when bending prevailed over torque (hcl), the cracks
initiation was always MODE I1 dominated, but cracks grew on the plane of maximum normal
stress for both in-phase and out-of-phase tests (Figures 11 and 12).
All the cracks patterns reported in Figures 7-12 were obtained by interrupting tests when the
bending or torsion stiffness drop was equal to 20%, but the fatigue data reanalysis has been
' In Figures 7-12 x-axes always emanate from one of the two points of maximum bending amplitude. Moreover, the
position on the gauge surfaces of each single x-axis changes, because the bi-dimensional develops have been plotted
by trying to show the crack distributions as clear as possible.