
Page 105 - Biaxial Multiaxial Fatigue and Fracture
P. 105
90 L. SUSMEL AND N PETRONE
EXPERIMENTAL RESULTS
The multiaxial fatigue behaviour of the considered aluminium alloy was studied by testing 44
different cylindrical specimens. Experimental tests were subdivided into four different groups:
pure bending tests, pure torsional tests, biaxial tests characterised by h=~~~,$o,,, less than 1 and
biaxial tests with h greater than 1. Moreover, each single biaxial experimental investigation was
performed by applying in-phase loadings and out-of-phase loading having a nominal phase angle
equal to 90" for h<l and 126" for bl.
The amplitude and the mean value of stress components as well as the phase angle were
calculated by using the average value of all the peaks of forces recorded during each single test.
The experimental results have been summarised in Tables 2-5, where the listed values refer to:
bending stress amplitude, sx,,; mean bending stress, sx,m; shear stress amplitude, z,~,~; mean shear
stress, z~~,~; biaxial stress ratio, h=~~~,$o~,~; phase angle between the applied stress components, 6;
number of cycles to failure, Nf,2%, defined using the 2% bending or torsion stiffness decrease
criterion.
By observing Table 3 it can be seen that a small bending stress component was always present
even under pure nominal torsional loadings. The value of measured ox,, ranged from 13 MPa up to
24 MPa and it was practically independent of the applied torsional stress amplitude. In any case,
the influence of the bending has been always disregarded because its value was in general
negligible if compared to the applied torque. The presence of this unwanted stress component
under pure torsional loadings was due to intrinsic plays within the ball-socket joints used to
connect the loading arm to the actuators.
The presence of these plays generated further complications under out-of phase loadings. In
particular, when h was greater than 1 the measured out-of-phase angle ranged between 125" and
129", that is, it was greater than the imposed nominal angle of 90".
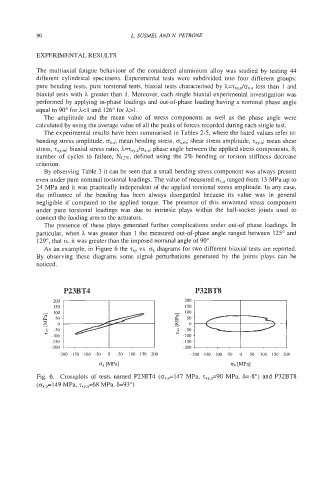
As an example, in Figure 6 the T~~ vs. ox diagrams for two different biaxial tests are reported.
By observing these diagrams some signal perturbations generated by the joints plays can be
noticed.
, 1 , I , 1 , I
-1501 , , , , -l50$ , , , ,
-200 -200
-200 -150 -100 -50 0 50 100 150 200 -200 -150 -100 -50 0 50 100 150 200
0, [MPal ox [mal
Fig. 6. Crossplots of tests named P23BT4 (oX,,=147 MPa, zxY,,=90 MPa, 6=-So) and P32BT8
(ox.,=149 MPa, ~,~,,=68 MPa, 6=93")