
Page 108 - Biaxial Multiaxial Fatigue and Fracture
P. 108
Multiaxial Fatigue Life Estimations for 6082-T6 Cylindrical Specimens Under ... 93
performed by extrapolating from the stiffness curve recorded during each single test the number of
cycles to failure corresponding to a stiffness decrease of 2%. The rule used to define the failure
had a strong influence on the width of Wohler fatigue curve scatter bands (Figure 13). In fact,
under bending loadings just two fatigue cracks were always generated at the maximum stress
points and the stiffness drop was a function of their total length; under torsional loadings the
stiffness drop was related to the rate of appearance of some dominant cracks, oriented by the
actual material morphology and usually generated by the coalescence and bridging of small
adjacent cracks. On the contrary, the cracks density, which depended on the applied stress
amplitude, seemed not to be correlated with the 20% stiffness drop. This situation became more
critical in the presence of biaxial loadings and it caused the experimental points to fall in wider
scatter bands when a torsional stress component was applied.
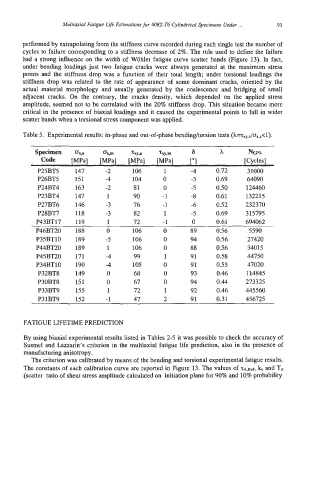
Table 5. Experimental results: in-phase and out-of-phase bendingkorsion tests (h=-~,~,~/o~,~<l).
Specimen ax,, axJn 'Cxyr 'Cxr,m 6 h. Nr,zo/.
Code [MPa] [MPa] [MPa] [MPa] ["I [Cycles]
P25BT5 147 -2 106 1 -4 0.72 31000
P26BT5 151 -4 104 0 -3 0.69 64090
P24BT4 163 -2 81 0 -5 0.50 124460
P23BT4 147 1 90 -1 -8 0.61 132215
P27BT6 146 -3 76 -1 -6 0.52 232370
P28BT7 118 -3 82 1 -5 0.69 315795
P43BT17 119 1 72 -1 0 0.61 694062
P46BT20 188 0 106 0 89 0.56 5590
P35BT10 189 -5 106 0 94 0.56 27420
P44BT20 189 1 106 0 88 0.56 34015
P45BT20 171 -4 99 1 91 0.58 44750
P34BT10 190 -4 105 0 91 0.55 47020
P32BT8 149 0 68 0 93 0.46 114845
P3OBT8 151 0 67 0 94 0.44 273325
P33BT9 155 1 72 1 92 0.46 445560
P31BT9 152 -1 47 2 91 0.31 456725
FATIGUE LIFETIME PREDICTION
By using biaxial experimental results listed in Tables 2-5 it was possible to check the accuracy of
Susmel and Lazzarin's criterion in the multiaxial fatigue life prediction, also in the presence of
manufacturing anisotropy.
The criterion was calibrated by means of the bending and torsional experimental fatigue results.
The constants of each calibration curve are reported in Figure 13. The values of k, and T,
(scatter ratio of shear stress amplitude calculated on initiation plane for 90% and 10% probability