
Page 193 - Biaxial Multiaxial Fatigue and Fracture
P. 193
Sequenced Axial and Torsional Cumulative Fatigue: ... 177
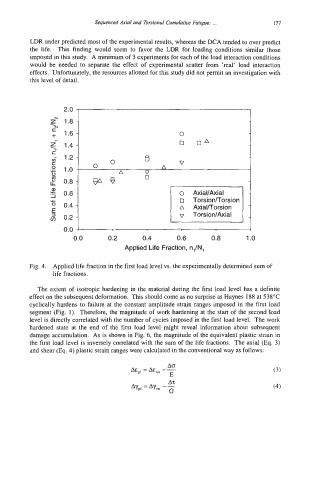
LDR under predicted most of the experimental results, whereas the DCA tended to over predict
the life. This finding would seem to favor the LDR for loading conditions similar those
imposed in this study. A minimum of 3 experiments for each of the load interaction conditions
would be needed to separate the effect of experimental scatter from 'real' load interaction
effects. Unfortunately, the resources allotted for this study did not permit an investigation with
this level of detail.
Z" 1.8 -
2
-
+ 1.6 - 0
5- 1.4 - nA
C
6 1.2 - 6
S 0 0 V
2 1.0 A
0 A V
,f 0.8 - 7 0
Q)
5 0.6 -
Torsion/Torsion
c 0.4 -
5 Torsion/Axial
v) 0.2 -
0.0 1
0.0 0.2 0.4 0.6 0.8 1 .o
Applied Life Fraction, n,/N,
Fig. 4. Applied life fraction in the first load level vs. the experimentally determined sum of
life fractions.
The extent of isotropic hardening in the material during the first load level has a definite
effect on the subsequent deformation. This should come as no surprise as Haynes 188 at 538°C
cyclically hardens to failure at the constant amplitude strain ranges imposed in the first load
segment (Fig. 1). Therefore, the magnitude of work hardening at the start of the second load
level is directly correlated with the number of cycles imposed in the first load level. The work
hardened state at the end of the first load level might reveal information about subsequent
damage accumulation. As is shown in Fig. 6, the magnitude of the equivalent plastic strain in
the first load level is inversely correlated with the sum of the life fractions. The axial (Eq. 3)
and shear (Eq. 4) plastic strain ranges were calculated in the conventional way as follows:
A0
A&,,, = ASlo, - - (3)
E
(4)