
Page 195 - Biaxial Multiaxial Fatigue and Fracture
P. 195
Sequenced Axial and Torsionai Cumulotive Fatigue: ... 179
The equivalent axial plastic strain for torsional loading is given in Eq. 5:
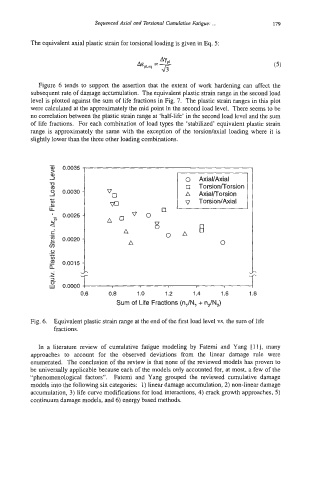
Figure 6 tends to support the assertion that the extent of work hardening can affect the
subsequent rate of damage accumulation. The equivalent plastic strain range in the second load
level is plotted against the sum of life fractions in Fig. 7. The plastic strain ranges in this plot
were calculated at the approximately the mid point in the second load level. There seems to be
no correlation between the plastic strain range at ‘half-life’ in the second load level and the sum
of life fractions. For each combination of load types the ‘stabilized’ equivalent plastic strain
range is approximately the same with the exception of the torsion/axial loading where it is
slightly lower than the three other loading combinations.
I
> 0.0035
(u
J
-0 Torsion/Torsion
a
3 0.0030 A AxialITorsion
c Torsion/Axial
2 00
ii 0
‘_ 0.0025 vo
wa A D
<I 8 E
i
.- A O A
2 0.0020
5 A 0
.-
0
L 1
v)
.S 0.0015
a
> .- I
3
0-
w 0.0000
0.6 0.8 1 .o 1.2 1.4 1.6 1 .a
Sum of Life Fractions (n,/N, + nJN,)
Fig. 6. Equivalent plastic strain range at the end of the first load level vs. the sum of life
fractions.
In a literature review of cumulative fatigue modeling by Fatemi and Yang [Ill, many
approaches to account for the observed deviations from the linear damage rule were
enumerated. The conclusion of the review is that none of the reviewed models has proven to
be universally applicable because each of the models only accounted for, at most, a few of the
“phenomenological factors”. Fatemi and Yang grouped the reviewed cumulative damage
models into the following six categories: 1) linear damage accumulation, 2) non-linear damage
accumulation, 3) life curve modifications, for load interactions, 4) crack growth approaches, 5)
continuum damage models, and 6) energy based methods.