
Page 213 - Biaxial Multiaxial Fatigue and Fracture
P. 213
Estimation of the Fatigue Life of High Strength Steel Under ... 197
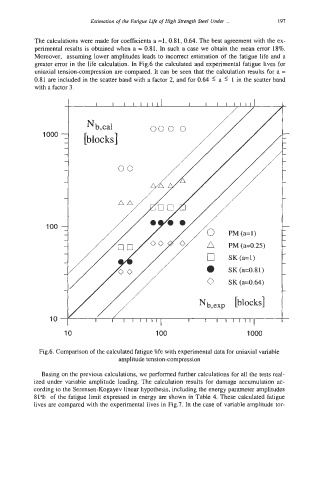
The calculations were made for coefficients a =1, 0.81, 0.64. The best agreement with the ex-
perimental results is obtained when a = 0.81. In such a case we obtain the mean error 18%.
Moreover, assuming lower amplitudes leads to incomct estimation of the fatigue life and a
greater error in the life calculation. In Fig.6 the calculated and experimental fatigue lives for
uniaxial tension-compression are compared. It can be seen that the calculation results for a =
0.81 are included in the scatter band with a factor 2, and for 0.64 2 a 5 1 in the scatter band
with a factor 3.
t
0 PM(a=l)
PM(a=O.25)
0 SK(a=l)
0 SK(a=0.81)
I/ 0 SK(~=O.M)
l/// Nb,exp [blocks]
10 1 Y I I I l l 1 1 1 ~ I I I I l l l l
10 100 1000
Fig.6. Comparison of the calculated fatigue life with experimental data for uniaxial variable
amplitude tension-compression
Basing on the previous calculations, we performed further calculations for all the tests real-
ized under variable amplitude loading. The calculation results for damage accumulation ac-
cording to the Serensen-Kogayev linear hypothesis, including the energy parameter amplitudes
81% of the fatigue limit expressed in energy are shown in Table 4. These calculated fatigue
lives are compared with the experimental lives in Fig.7. In the case of variable amplitude tor-