
Page 33 - Biaxial Multiaxial Fatigue and Fracture
P. 33
18 K. DANG VAN, A. BIGNONNET AND J.L. FAYARD
OPTIMIZATION OF THE WELDING PROCESS
When thick sheets are welded, one can expect high remaining residual stresses as well as a
large scatter in local geometry. The proposed structural approach allows the study of the
influence of these parameters using the fatigue law determined by PSA-Peugeot-Citroen
(PSA).
Researchers of Institut de Soudure of France (IS.) have used Dang Van’s fatigue approach
[4] to interpret fatigue tests performed on fillet welds in order to characterise the quality of the
weld (which can be described by the smoothness of the weld toe) and the influence of residual
stresses on the fatigue resistance, since the classical existing approaches give a poor description
of these factors. It is not possible for instance to correlate quantitatively the local geometry and
the residual stress distribution to the fatigue behaviour. The use of a local approach allows
better physical interpretation [15].
In order to be able to take into account the effect of residual stresses and the weld geometry,
a systematic research program was undertaken by the I.S. Fillet welds obtained by one pass or
by three passes were simulated for a S355 steel with a bainitic transformation at cooling. Two
sides one-pass fillet welds were first considered and tested. Numerical simulations to evaluate
the corresponding residual stress distributions were performed by using the SYSWELD
software. Experimental X-ray measurements were carried out to verify the validity (near the
surface only) of the prediction. One-side fillet welds carried out in three passes were also
examined. The welded pieces were 20mm thick and were free of any clamping.
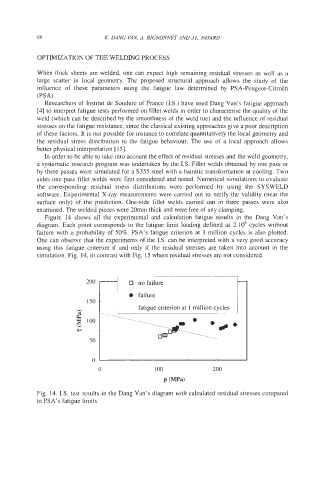
Figure 14 shows all the experimental and calculation fatigue results in the Dang Van’s
diagram. Each point corresponds to the fatigue limit loading defined as 2.106 cycles without
failure with a probability of 50%. PSA’s fatigue criterion at 1 million cycles is also plotted.
One can observe that the experiments of the IS. can be interpreted with a very good accuracy
using this fatigue criterion if and only if the residual stresses are taken into account in the
simulation, Fig. 14, in contrast with Fig. 15 where residual stresses are not considered.
200 0 no failure -
0 failure
150 -
fatigue criterion at 1 million cycles
h ~
0 100 200
P (MPa)
Fig. 14. IS. test results in the Dang Van’s diagram with calculated residual stresses compared
to PSA’s fatigue limits