
Page 452 - Biaxial Multiaxial Fatigue and Fracture
P. 452
436 I: ITOH AND I: MIYAzllKI
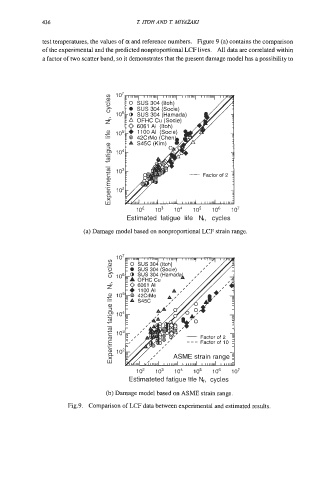
test temperatures, the values of a and reference numbers. Figure 9 (a) contains the comparison
of the experimental and the predicted nonproportional LCF lives. All data are correlated within
a factor of two scatter band, so it demonstrates that the present damage model has a possibility to
io2 io3 io4 io5 io6 io7
Estimated fatigue life 4, cycles
(a) Damage model based on nonproportional LCF strain range.
io2 io3 io4 io5 io6 io7
Estimateted fatigue life Nf, cycles
(b) Damage model based on ASME strain range.
Fig.9. Comparison of LCF data between experimental and estimated results.