
Page 448 - Biaxial Multiaxial Fatigue and Fracture
P. 448
432 T ITOH AND T MIYAZAKI
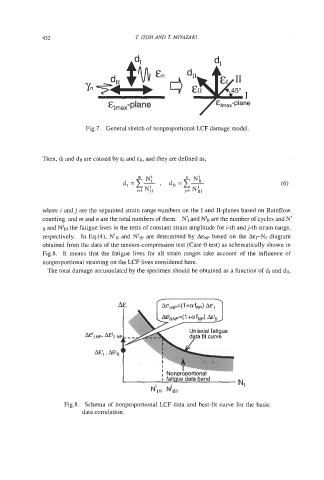
Fig.7. General sketch of nonproportional LCF damage model.
Then, dl and dl1 are caused by EI and Ell, and they are defined as,
where i and j are the separated strain range numbers on the I and 11-planes based on Rainflow
counting, and rn and n are the total numbers of them. Nil and NJ,, are the number of cycles and Ni
If and NJllf the fatigue lives in the tests of constant strain amplitude for i-th andj-th strain range,
respectively. In Eq.(4), N'If and NJllf are determined by AEN~ based on the AEI-Nf diagram
obtained from the data of the tension-compression test (Case 0 test) as schematically shown in
Fig.8. It means that the fatigue lives for all strain ranges take account of the influence of
nonproportional straining on the LCF lives considered here.
The total damage accumulated by the specimen should be obtained as a function of dl and dll,
A~'INp=(l+af,p) A&',
AEJnNp=( 1 +afNp) AEJrr
Uniaxial fatigue
data fit curve
I
I
, lvullylupulllullal
I fatique data band
N f
N'Ifl NJm
Fig.8. Schema of nonproportional LCF data and best-fit curve for the basic
data correlation.