
Page 444 - Biaxial Multiaxial Fatigue and Fracture
P. 444
428 I: ITOH AND I: MIYAZARI
where a is the material constant which distinguishes the material dependency of additional
hardening and fNp the nonproportional intensity factor which expresses the strength of
nonproportional loading. The value of a is defined as the ratio of the stress amplitude under 90
degrees out-of-phase loading (circular strain path in the Y/&E plot) to that under proportional
loading. Among all the nonproportional histories, the 90 degrees out-of-phase loading shows
the maximum additional hardening [3]. For 304SS, the stress amplitude under 90 degrees
out-of-phase loading was increased up to 90% in comparison with the proportional loading, so
the value of a reaches 0.9 141. For 6061A1, it was 0.2 due to the small additional hardeningf.81.
The nonproportional intensity factor which accounts for the severity of nonproportional
strain is calculated from the strain history only, and is defined by
where Tis the time for a cycle and fnp is normalized by k, T and &lmax. k is a constant to make fnp
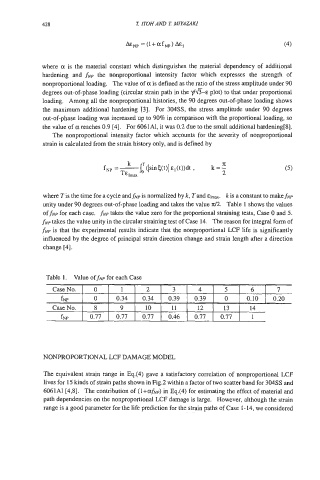
unity under 90 degrees out-of-phase loading and takes the value d2. Table 1 shows the values
of fNp for each case. fNp takes the value zero for the proportional straining tests, Case 0 and 5.
fNp takes the value unity in the circular straining test of Case 14. The reason for integral form of
fNp is that the experimental results indicate that the nonproportional LCF life is significantly
influenced by the degree of principal strain direction change and strain length after a direction
change [4].
Case No. 0 1 2 3 4 5 6 1 7
fNP 0 0.34 0.34 0.39 0.39 0 0.10 I 0.20
Case No. 8 9 10 11 12 13 14
fNP 0.77 0.77 0.77 0.46 0.77 0.77 1
NONPROPORTIONAL LCF DAMAGE MODEL
The equivalent strain range in Eq.(4) gave a satisfactory correlation of nonproportional LCF
lives for 15 kinds of strain paths shown in Fig.2 within a factor of two scatter band for 304SS and
6061A1 [4,8]. The contribution of (l+af~p) in Eq.(4) for estimating the effect of material and
path dependencies on the nonproportional LCF damage is large. However, although the strain
range is a good parameter for the life prediction for the strain paths of Case 1-14, we considered