
Page 442 - Biaxial Multiaxial Fatigue and Fracture
P. 442
426 I: ITOH AND t MIYAZAKI
&,(t) direction Strain path in
on specimen &,(t)-c(t) polar figure
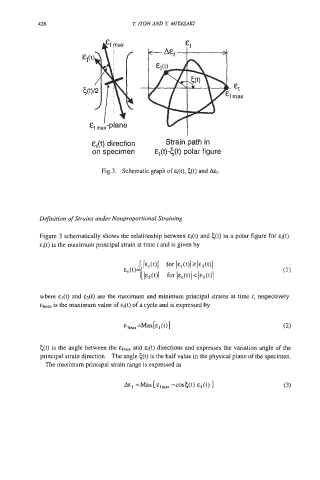
Fig.3. Schematic graph of &l(t), c(t) and AEI.
Definition of Strains under Nonproportional Straining
Figure 3 schematically shows the relationship between &I(t) and c(t) in a polar figure for EI(t).
&l(t) is the maximum principal strain at time t and is given by
where El(t) and E3(t) are the maximum and minimum principal strains at time t, respectively.
is the maximum value of &l(t) of a cycle and is expressed by
c(t) is the angle between the &lmax and El(t) directions and expresses the variation angle of the
principal strain direction. The angle c(t) is the half value in the physical plane of the specimen.
The maximum principal strain range is expressed as