
Page 178 - Big Data Analytics for Intelligent Healthcare Management
P. 178
6.5 CONCLUSION AND FUTURE WORK 171
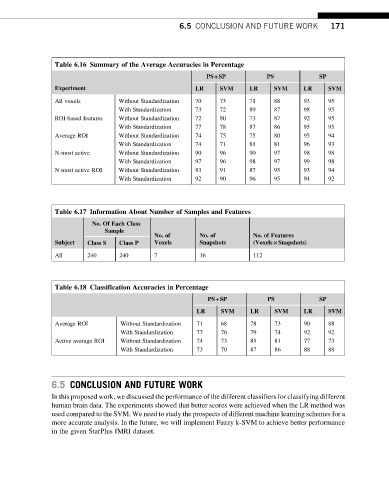
Table 6.16 Summary of the Average Accuracies in Percentage
PS+SP PS SP
Experiment LR SVM LR SVM LR SVM
All voxels Without Standardization 70 73 71 88 93 95
With Standardization 73 72 89 87 98 95
ROI-based features Without Standardization 72 80 73 87 92 95
With Standardization 77 78 87 86 95 95
Average ROI Without Standardization 74 75 75 80 95 94
With Standardization 74 71 81 81 96 93
N-most active Without Standardization 90 96 90 97 98 98
With Standardization 97 96 98 97 99 98
N-most active ROI Without Standardization 83 91 87 95 93 94
With Standardization 92 90 96 95 94 92
Table 6.17 Information About Number of Samples and Features
No. Of Each Class
Sample
No. of No. of No. of Features
Subject Class S Class P Voxels Snapshots (Voxels×Snapshots)
All 240 240 7 16 112
Table 6.18 Classification Accuracies in Percentage
PS+SP PS SP
LR SVM LR SVM LR SVM
Average ROI Without Standardization 71 68 78 73 90 88
With Standardization 77 76 79 74 92 92
Active average ROI Without Standardization 74 73 85 81 77 73
With Standardization 73 70 87 86 88 88
6.5 CONCLUSION AND FUTURE WORK
In this proposed work, we discussed the performance of the different classifiers for classifying different
human brain data. The experiments showed that better scores were achieved when the LR method was
used compared to the SVM. We need to study the prospects of different machine learning schemes for a
more accurate analysis. In the future, we will implement Fuzzy k-SVM to achieve better performance
in the given StarPlus fMRI dataset.