
Page 196 - Big Data Analytics for Intelligent Healthcare Management
P. 196
7.5 SIMULATION AND RESULT DISCUSSION 189
As discussed above, the system is implemented and data is displayed on the LCD screen. The system is
in its initial stage for testing and it has so far been tested successfully. The temperature sensor and pulse
rate sensor have been connected to Arduino for testing and snapshots of results have been taken. The
results can be seen in the serial monitor and serial plotter. The results displayed are analog raw data and
those results are utilized for further data processing. The Adafruit cloud registration process is also
shown in Figs. 11–13.
7.5 SIMULATION AND RESULT DISCUSSION
The earlier sections discussed the connections and real time implementation of the whole system. This
section will include all the results that have been obtained after successful completion and implemen-
tation of the system. This will include the outputs of the real time dynamic values from the cloud. The
results were taken at different time intervals and plotted accordingly in the cloud. We have taken nine
different readings shown in the screen shots from Figs. 7.14 to 7.22.
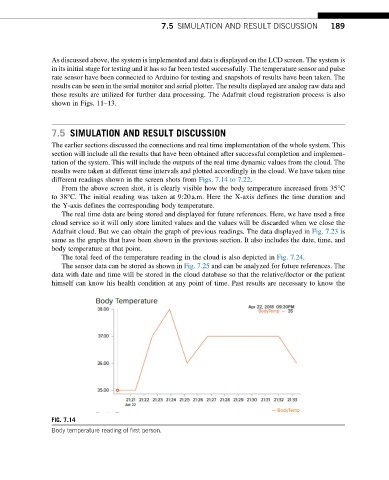
From the above screen shot, it is clearly visible how the body temperature increased from 35°C
to 38°C. The initial reading was taken at 9:20a.m. Here the X-axis defines the time duration and
the Y-axis defines the corresponding body temperature.
The real time data are being stored and displayed for future references. Here, we have used a free
cloud service so it will only store limited values and the values will be discarded when we close the
Adafruit cloud. But we can obtain the graph of previous readings. The data displayed in Fig. 7.23 is
same as the graphs that have been shown in the previous section. It also includes the date, time, and
body temperature at that point.
The total feed of the temperature reading in the cloud is also depicted in Fig. 7.24.
The sensor data can be stored as shown in Fig. 7.25 and can be analyzed for future references. The
data with date and time will be stored in the cloud database so that the relative/doctor or the patient
himself can know his health condition at any point of time. Past results are necessary to know the
FIG. 7.14
Body temperature reading of first person.