
Page 191 - Big Data Analytics for Intelligent Healthcare Management
P. 191
184 CHAPTER 7 SMART HEALTHCARE
FIG. 7.5
Prototype of proposed system showing heart rate and body temperature.
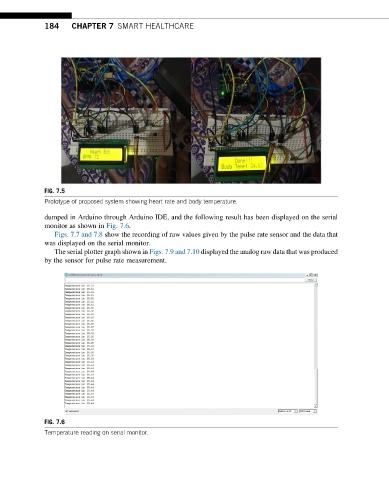
dumped in Arduino through Arduino IDE, and the following result has been displayed on the serial
monitor as shown in Fig. 7.6.
Figs. 7.7 and 7.8 show the recording of raw values given by the pulse rate sensor and the data that
was displayed on the serial monitor.
The serial plotter graph shown in Figs. 7.9 and 7.10 displayed the analog raw data that was produced
by the sensor for pulse rate measurement.
FIG. 7.6
Temperature reading on serial monitor.