
Page 115 - Biodegradable Polyesters
P. 115
4.4 Mathematical Modeling of the Synthesis of Aliphatic Polyesters 93
1.0
0.8
Conversion 0.6
0.4
0.2
0.0
0 50 100 150 200 250 300 350
Time (min)
−3
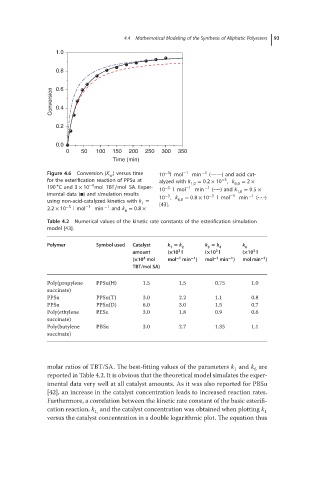
Figure 4.6 Conversion (X ) versus time 10 lmol −1 min −1 (——) and acid cat-
w
for the esterification reaction of PPSu at alyzed with k 1,0 = 0.2 × 10 , k 6,0 = 2 ×
−3
∘
−4
190 Cand 3 × 10 mol TBT∕mol SA. Exper- −3 −1 −1
10 lmol min (----) and k 1,0 = 0.5 ×
imental data (◾) and simulation results −3 −3 −1 −1
using non-acid-catalyzed kinetics with k = 10 , k 6,0 = 0.8 × 10 lmol min (-.-.-)
1
2.2 × 10 −3 lmol −1 min −1 and k = 0.8 × [43].
6
Table 4.2 Numerical values of the kinetic rate constants of the esterification simulation
model [43].
Polymer Symbol used Catalyst k = k 2 k = k 4 k 6
3
1
3
3
3
amount (×10 l (×10 l (×10 l
4
−1
−1
−1
(×10 mol mol −1 min ) mol −1 min ) mol min )
TBT/mol SA)
Poly(propylene PPSu(H) 1.5 1.5 0.75 1.0
succinate)
PPSu PPSu(T) 3.0 2.2 1.1 0.8
PPSu PPSu(D) 6.0 3.0 1.5 0.7
Poly(ethylene PESu 3.0 1.8 0.9 0.6
succinate)
Poly(butylene PBSu 3.0 2.7 1.35 1.1
succinate)
molar ratios of TBT/SA. The best-fitting values of the parameters k and k are
1
6
reported in Table 4.2. It is obvious that the theoretical model simulates the exper-
imental data very well at all catalyst amounts. As it was also reported for PBSu
[42], an increase in the catalyst concentration leads to increased reaction rates.
Furthermore, a correlation between the kinetic rate constant of the basic esterifi-
cation reaction, k and the catalyst concentration was obtained when plotting k 1
1,
versus the catalyst concentration in a double logarithmic plot. The equation thus