
Page 87 - Biofuels Refining and Performance
P. 87
70 Chapter Three
whey, and some other similar sources, which contain simple sugars and
their polymers. On the other hand, synthetic ethanol is produced from
oil, e.g., through hydration of ethylene:
H 2 O
Oil → CH CH (ethylene) ⎯→ CH CH OH (ethanol) (3.1)
2
3
2
2
Several companies, such as Sasol, SADAF, British Petroleum, and Equistar,
produce synthetic ethanol, with capacities of 100–400 kilotons/yr.
However, the share of synthetic ethanol in world ethanol production was
less than 4% in 2006, down from 7% in the 1990s [4]. Furthermore,
increasing oil price or declining ethanol price can harm the economic
competition of synthetic ethanol production, compared to the fermen-
tative one. Ethylene prices in 2005 rose to US $1000 per ton, while
ethanol values were around US $500 per ton. If we consider the theo-
retical yield of ethanol from ethylene based on Eq. (3.1) as 1.64 kg/kg,
the price of raw materials was higher than that of the product. In this
case, it is economically feasible to produce biobased plastics through
“bioethylene”:
Fermentation H 2 O
Biomass/crops ⎯⎯⎯⎯→ CH CH OH ⎯→ CH CH → Plastics (3.2)
2
2
3
2
The global demand for ethylene is around 120 megatons [4]. It can be
considered a new market for ethanol in the future.
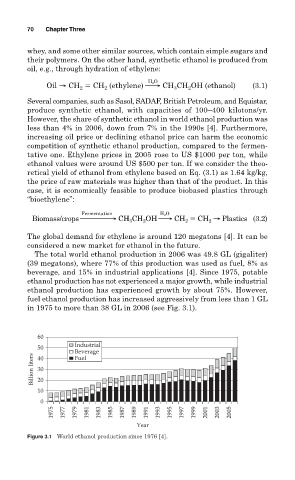
The total world ethanol production in 2006 was 49.8 GL (gigaliter)
(39 megatons), where 77% of this production was used as fuel, 8% as
beverage, and 15% in industrial applications [4]. Since 1975, potable
ethanol production has not experienced a major growth, while industrial
ethanol production has experienced growth by about 75%. However,
fuel ethanol production has increased aggressively from less than 1 GL
in 1975 to more than 38 GL in 2006 (see Fig. 3.1).
60
50 Industrial
Beverage
Billion liters 30
40
Fuel
20
10
0
1975 1977 1979 1981 1983 1985 1987 1989 1991 1993 1995 1997 1999 2001 2003 2005
Year
Figure 3.1 World ethanol production since 1976 [4].