
Page 88 - Biofuels Refining and Performance
P. 88
Bioethanol: Market and Production Processes 71
There is competition between Brazil and the United States to be the
dominant ethanol producer in the world. So far, Brazil has been the largest
ethanol producer, but the statistics from 2006 imply that the United
States is the largest ethanol producer with 19.1 GL, followed by Brazil
with 16.7 GL. Both countries produced almost identical amounts of
ethanol in 2005 (16.2 and 16.0 GL, respectively). The American conti-
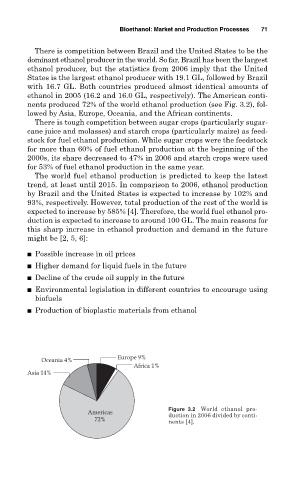
nents produced 72% of the world ethanol production (see Fig. 3.2), fol-
lowed by Asia, Europe, Oceania, and the African continents.
There is tough competition between sugar crops (particularly sugar-
cane juice and molasses) and starch crops (particularly maize) as feed-
stock for fuel ethanol production. While sugar crops were the feedstock
for more than 60% of fuel ethanol production at the beginning of the
2000s, its share decreased to 47% in 2006 and starch crops were used
for 53% of fuel ethanol production in the same year.
The world fuel ethanol production is predicted to keep the latest
trend, at least until 2015. In comparison to 2006, ethanol production
by Brazil and the United States is expected to increase by 102% and
93%, respectively. However, total production of the rest of the world is
expected to increase by 585% [4]. Therefore, the world fuel ethanol pro-
duction is expected to increase to around 100 GL. The main reasons for
this sharp increase in ethanol production and demand in the future
might be [2, 5, 6]:
Possible increase in oil prices
Higher demand for liquid fuels in the future
Decline of the crude oil supply in the future
Environmental legislation in different countries to encourage using
biofuels
Production of bioplastic materials from ethanol
Europe 9%
Oceania 4%
Africa 1%
Asia 14%
Figure 3.2 World ethanol pro-
Americas duction in 2006 divided by conti-
72% nents [4].