
Page 171 - Biofuels for a More Sustainable Future
P. 171
Life cycle sustainability assessment in the energy sector 155
other indicators derived from LCA and SLCA are based on predictions of
technological development such as improvements in solar cell efficiency
and wind farm capacity factor.
3.2.4 Interpretation
Due to the number of indicators and technology options as well as the time-
span of the assessment, it is not possible to show all the outputs here. Inter-
ested readers are directed to Stamford and Azapagic (2014) for further detail.
However, this section highlights some of the key results to illustrate how
such an assessment can assist decision-making and policy.
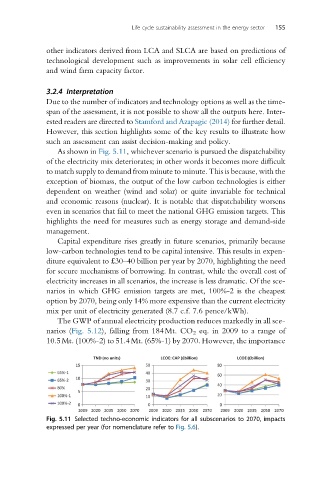
As shown in Fig. 5.11, whichever scenario is pursued the dispatchability
of the electricity mix deteriorates; in other words it becomes more difficult
to match supply to demand from minute to minute. This is because, with the
exception of biomass, the output of the low carbon technologies is either
dependent on weather (wind and solar) or quite invariable for technical
and economic reasons (nuclear). It is notable that dispatchability worsens
even in scenarios that fail to meet the national GHG emission targets. This
highlights the need for measures such as energy storage and demand-side
management.
Capital expenditure rises greatly in future scenarios, primarily because
low-carbon technologies tend to be capital intensive. This results in expen-
diture equivalent to £30–40 billion per year by 2070, highlighting the need
for secure mechanisms of borrowing. In contrast, while the overall cost of
electricity increases in all scenarios, the increase is less dramatic. Of the sce-
narios in which GHG emission targets are met, 100%-2 is the cheapest
option by 2070, being only 14% more expensive than the current electricity
mix per unit of electricity generated (8.7 c.f. 7.6 pence/kWh).
The GWP of annual electricity production reduces markedly in all sce-
narios (Fig. 5.12), falling from 184Mt. CO 2 eq.in 2009toarangeof
10.5Mt. (100%-2) to 51.4Mt. (65%-1) by 2070. However, the importance
Fig. 5.11 Selected techno-economic indicators for all subscenarios to 2070, impacts
expressed per year (for nomenclature refer to Fig. 5.6).