
Page 80 - Biomedical Engineering and Design Handbook Volume 1, Fundamentals
P. 80
HEAT TRANSFER APPLICATIONS IN BIOLOGICAL SYSTEMS 57
diameter is capable of providing a specific loss power (SLP) of 211 W/g under a magnetic field of
14 kA/m in amplitude and 300 kHz in frequency. In contrast, particles with diameter of 220 nm only
achieve an SLP of 144 W/g under identical conditions (Hilger et al., 2001). Therefore, nanoparticle
hyperthermia provides a more effective and clinically safer therapeutic alternative for cancer treat-
ment than microparticles.
The quantification of heat generated by the particles has suggested that the size of the individual
particle and properties of the magnetic field (strength and frequency) determine its heating capacity.
Hence, given the particle size and magnetic field strength, it is the spatial distribution of the particle
dispersed in tissue that affects the resulting temperature elevation. However, it is not clear how the
spatial concentration of the particles in the tissue correlates with the particle concentration in the car-
rier solution before the injection. In nanofluid transport in tissue, the injection strategy as well as
interaction between particle and the porous interstitial space may affect the particle distribution. An
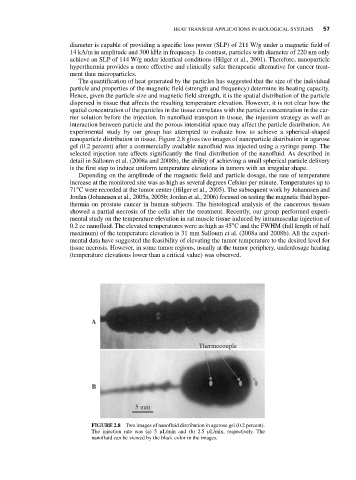
experimental study by our group has attempted to evaluate how to achieve a spherical-shaped
nanoparticle distribution in tissue. Figure 2.8 gives two images of nanoparticle distribution in agarose
gel (0.2 percent) after a commercially available nanofluid was injected using a syringe pump. The
selected injection rate affects significantly the final distribution of the nanofluid. As described in
detail in Salloum et al. (2008a and 2008b), the ability of achieving a small spherical particle delivery
is the first step to induce uniform temperature elevations in tumors with an irregular shape.
Depending on the amplitude of the magnetic field and particle dosage, the rate of temperature
increase at the monitored site was as high as several degrees Celsius per minute. Temperatures up to
71°C were recorded at the tumor center (Hilger et al., 2005). The subsequent work by Johannsen and
Jordan (Johannsen et al., 2005a, 2005b; Jordan et al., 2006) focused on testing the magnetic fluid hyper-
thermia on prostate cancer in human subjects. The histological analysis of the cancerous tissues
showed a partial necrosis of the cells after the treatment. Recently, our group performed experi-
mental study on the temperature elevation in rat muscle tissue induced by intramuscular injection of
0.2 cc nanofluid. The elevated temperatures were as high as 45°C and the FWHM (full length of half
maximum) of the temperature elevation is 31 mm Salloum et al. (2008a and 2008b). All the experi-
mental data have suggested the feasibility of elevating the tumor temperature to the desired level for
tissue necrosis. However, in some tumor regions, usually at the tumor periphery, underdosage heating
(temperature elevations lower than a critical value) was observed.
A
Thermocouple
B
5 mm
FIGURE 2.8 Two images of nanofluid distribution in agarose gel (0.2 percent).
The injection rate was (a) 5 μL/min and (b) 2.5 μL/min, respectively. The
nanofluid can be viewed by the black color in the images.